Free US Retail Ad Frequency vs Conversion Rate from 2015 to 2025 Chart
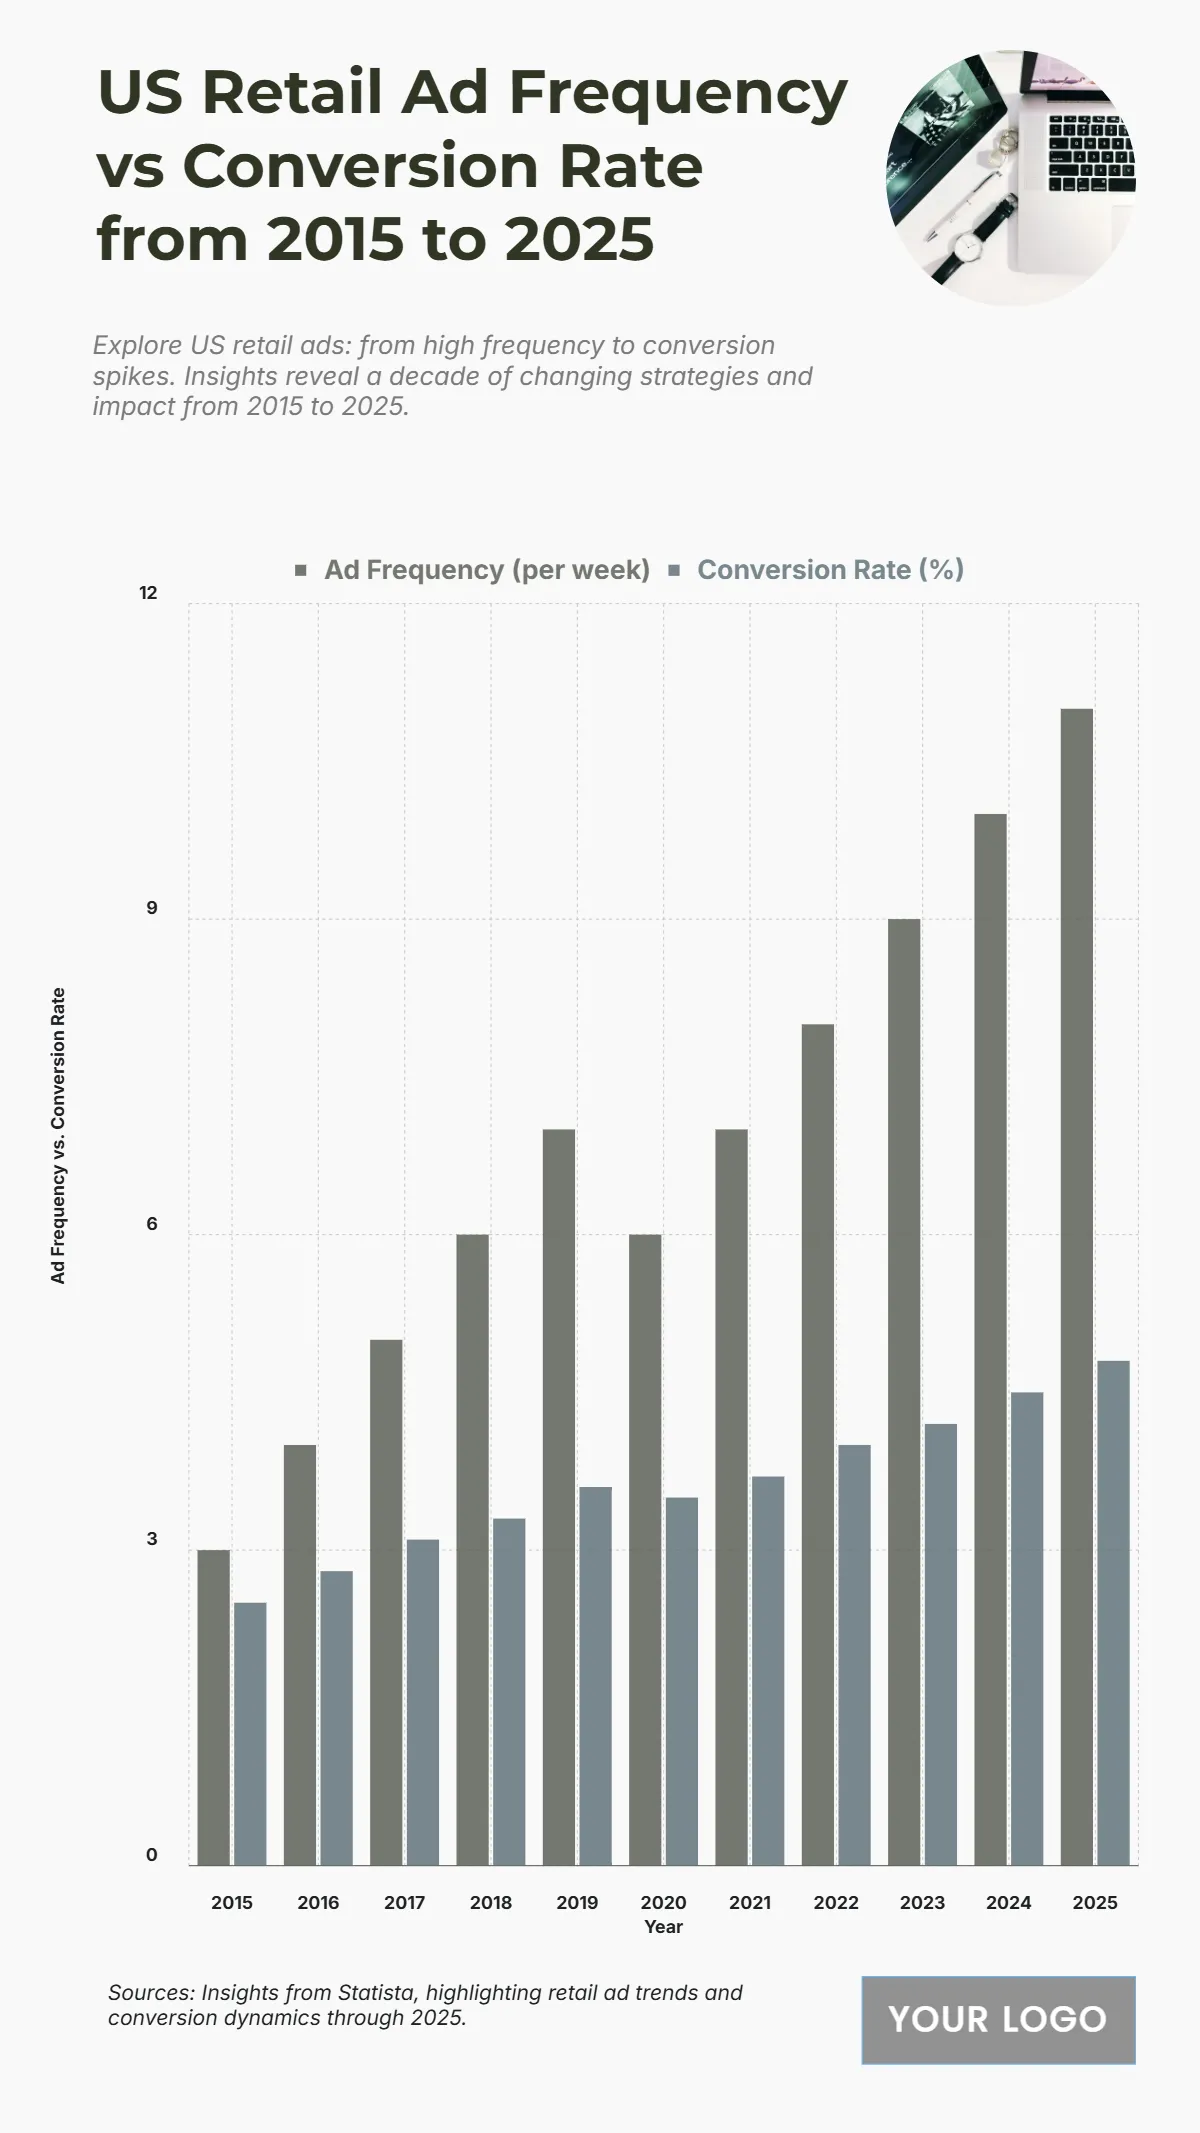
The chart displays the US Retail Ad Frequency (per week) and Conversion Rate (%) from 2015 to 2025, illustrating a general positive correlation between the two metrics. In 2015, the ad frequency was 3 per week, with a conversion rate of 2.5%. Both figures showed a consistent increase up to 2019, when frequency was 7 and conversion rate was 3.6%. The frequency dipped slightly in 2020 to 6 per week, though the conversion rate only saw a minimal drop to 3.5%. Following 2020, both metrics resumed their growth, with frequency reaching 10 in 2024 and a conversion rate of 4.5%. The highest projected figures are in 2025, with an ad frequency of 11 per week and a conversion rate of 4.8%. Over the decade, the conversion rate has nearly doubled, rising by 2.3 percentage points, while ad frequency has nearly quadrupled, suggesting that increased ad exposure has driven higher conversion effectiveness for US retail over time.
| Labels | Ad Frequency (per week) | Conversion Rate (%) |
| 2015 | 3 | 2.5 |
| 2016 | 4 | 2.8 |
| 2017 | 5 | 3.1 |
| 2018 | 6 | 3.3 |
| 2019 | 7 | 3.6 |
| 2020 | 6 | 3.5 |
| 2021 | 7 | 3.7 |
| 2022 | 8 | 4 |
| 2023 | 9 | 4.2 |
| 2024 | 10 | 4.5 |
| 2025 | 11 | 4.8 |


