Free US Retailer Online Ad View Rate by Platform from 2020 to 2025 Chart
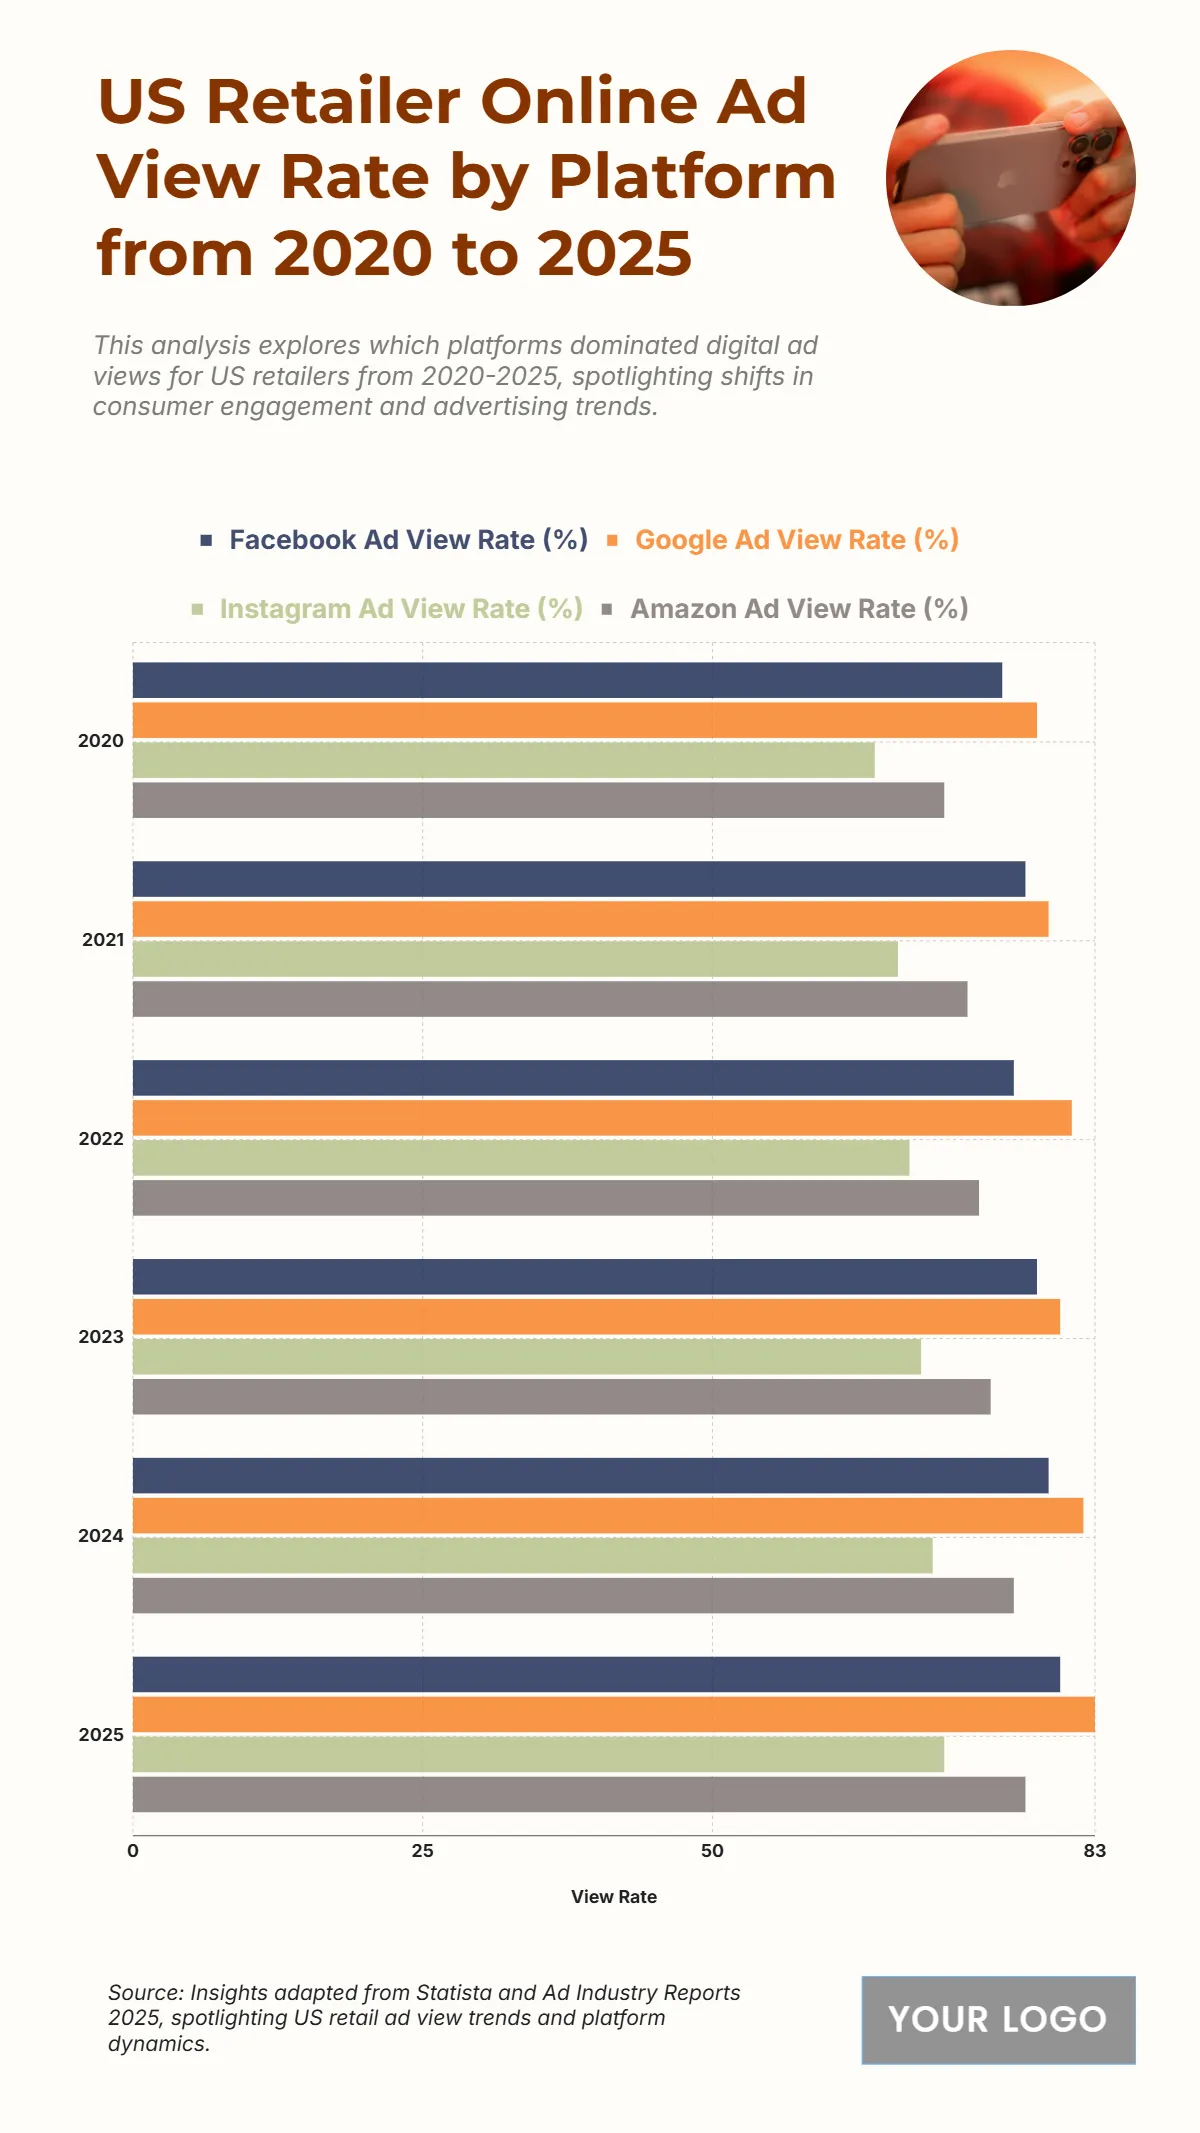
The chart displays the US Retailer Online Ad View Rate (%) for four major platforms from 2020 to 2025, indicating a consistent ranking across the years. Google Ad View Rate (%) is the highest in all years, starting at 78% in 2020 and projected to reach 83% in 2025. Facebook Ad View Rate (%) is consistently the second highest, starting at 75% in 2020 and rising to 80% in 2025. Amazon Ad View Rate (%) ranks third, beginning at 70% in 2020 and increasing to 77% in 2025. Instagram Ad View Rate (%) is the lowest across the entire period, starting at 64% in 2020 and projected to reach 70% in 2025. All four platforms show a positive growth trend over the six years, with Google maintaining its dominance in ad viewability for US retailers.
| Labels | Facebook Ad View Rate (%) | Google Ad View Rate (%) | Instagram Ad View Rate (%) | Amazon Ad View Rate (%) |
| 2020 | 75 | 78 | 64 | 70 |
| 2021 | 77 | 79 | 66 | 72 |
| 2022 | 76 | 81 | 67 | 73 |
| 2023 | 78 | 80 | 68 | 74 |
| 2024 | 79 | 82 | 69 | 76 |
| 2025 | 80 | 83 | 70 | 77 |


