Free US Streaming Subscription Ad Revenue Growth from 2015 to 2025 Chart
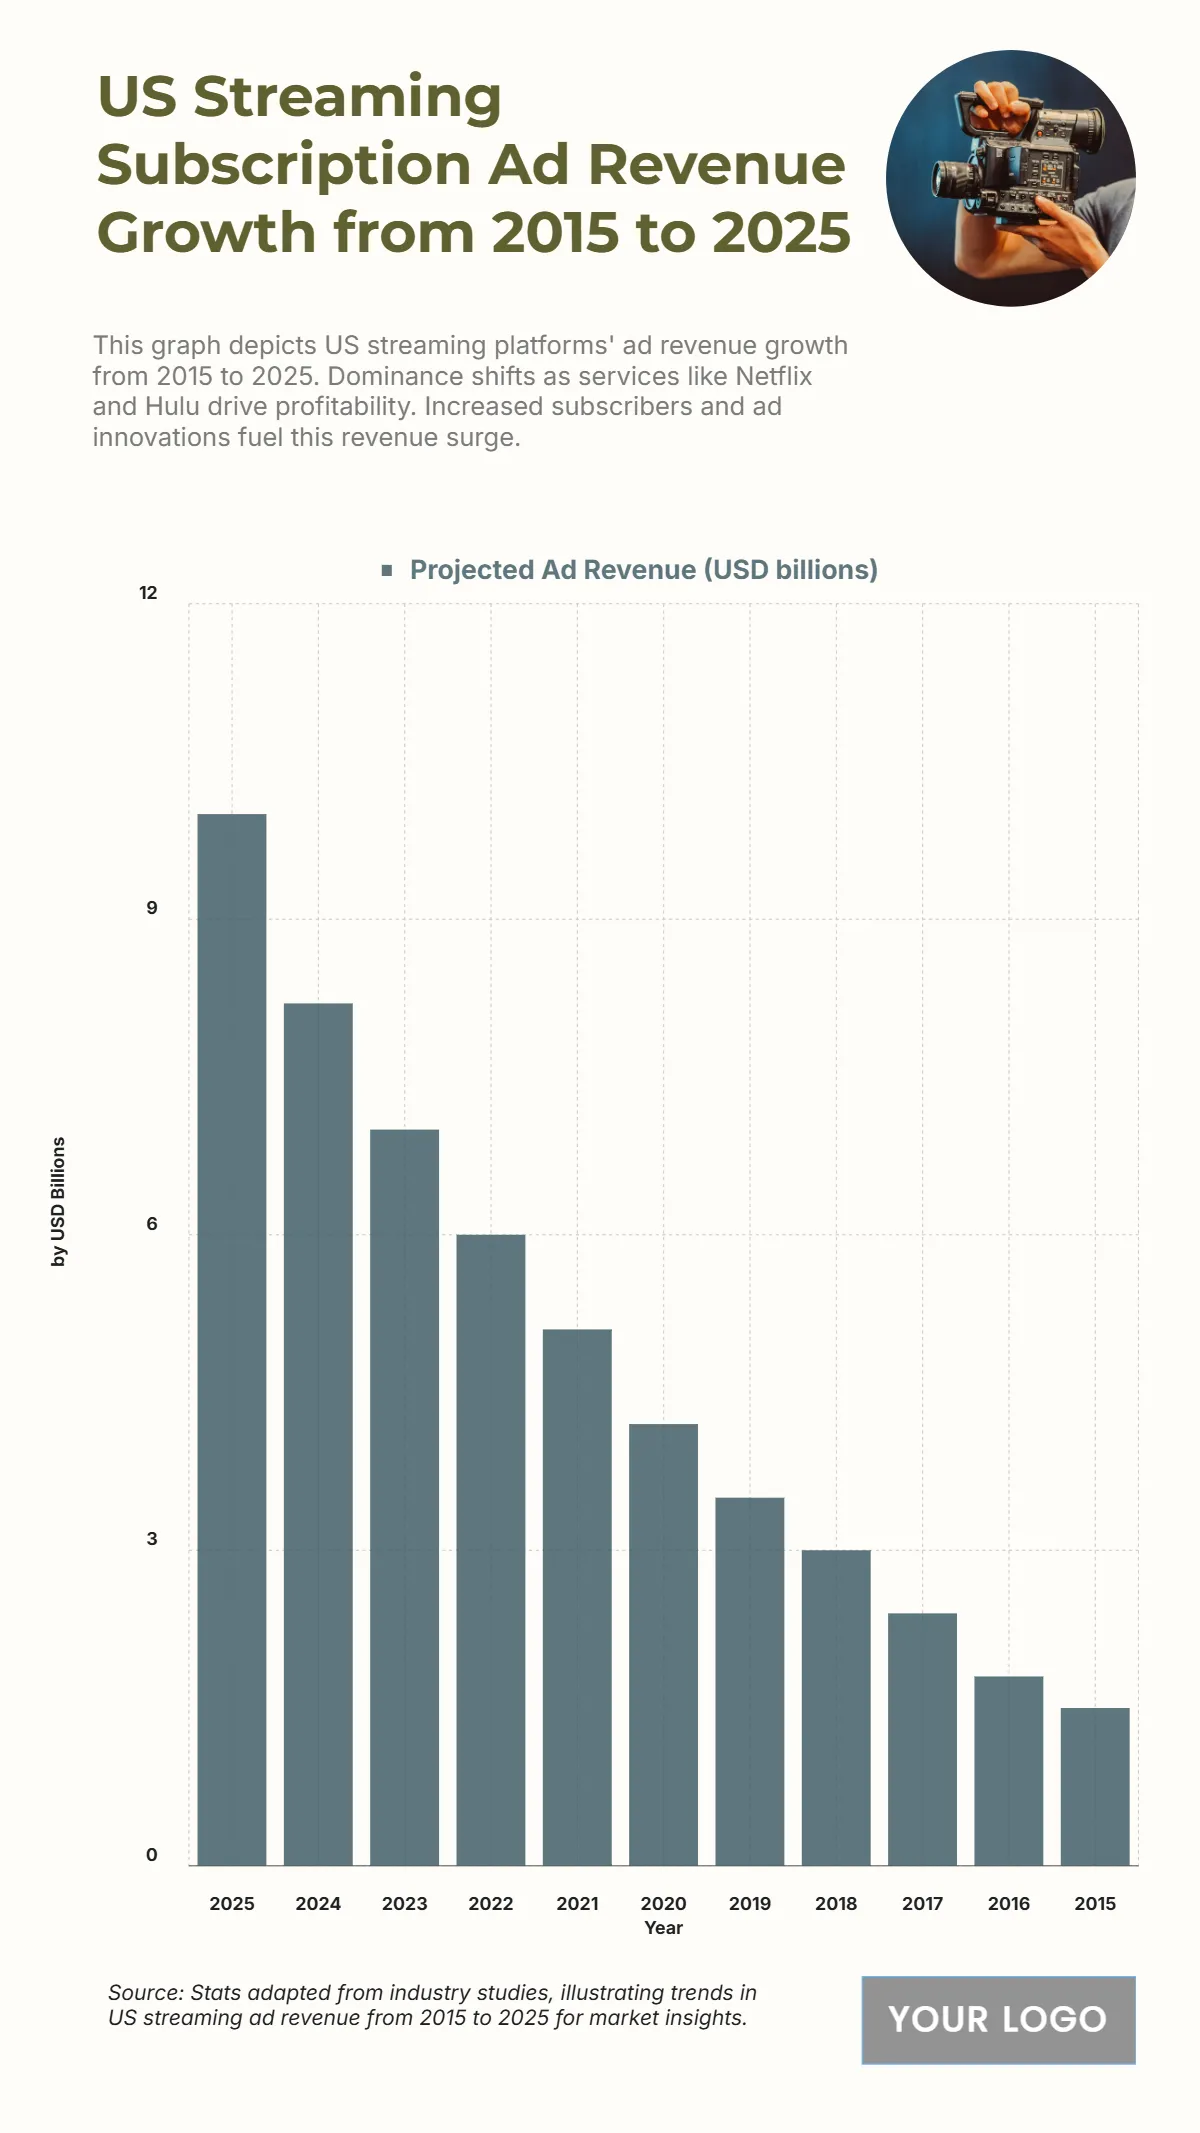
The chart shows a strong upward trajectory in US streaming subscription ad revenue over a 10-year span. Starting at USD 1.5 billion in 2015, revenue grew steadily to USD 10 billion by 2025, showcasing the rapid expansion of streaming platforms. Major increases occurred between 2018 and 2022, where revenue nearly doubled from USD 3 billion to USD 6 billion as streaming adoption surged. 2023 marked USD 7 billion, with projected acceleration to USD 8.2 billion in 2024 and USD 10 billion in 2025, reflecting enhanced ad models, broader subscriber bases, and platform diversification. This consistent growth highlights the increasing dominance of digital streaming over traditional ad formats.
| Labels | Projected Ad Revenue (USD billions) |
|---|---|
| 2025 | 10 |
| 2024 | 8.2 |
| 2023 | 7 |
| 2022 | 6 |
| 2021 | 5.1 |
| 2020 | 4.2 |
| 2019 | 3.5 |
| 2018 | 3 |
| 2017 | 2.4 |
| 2016 | 1.8 |
| 2015 | 1.5 |


