Free US Social Media Video Ad Performance by Platform from 2018 to 2025 Chart
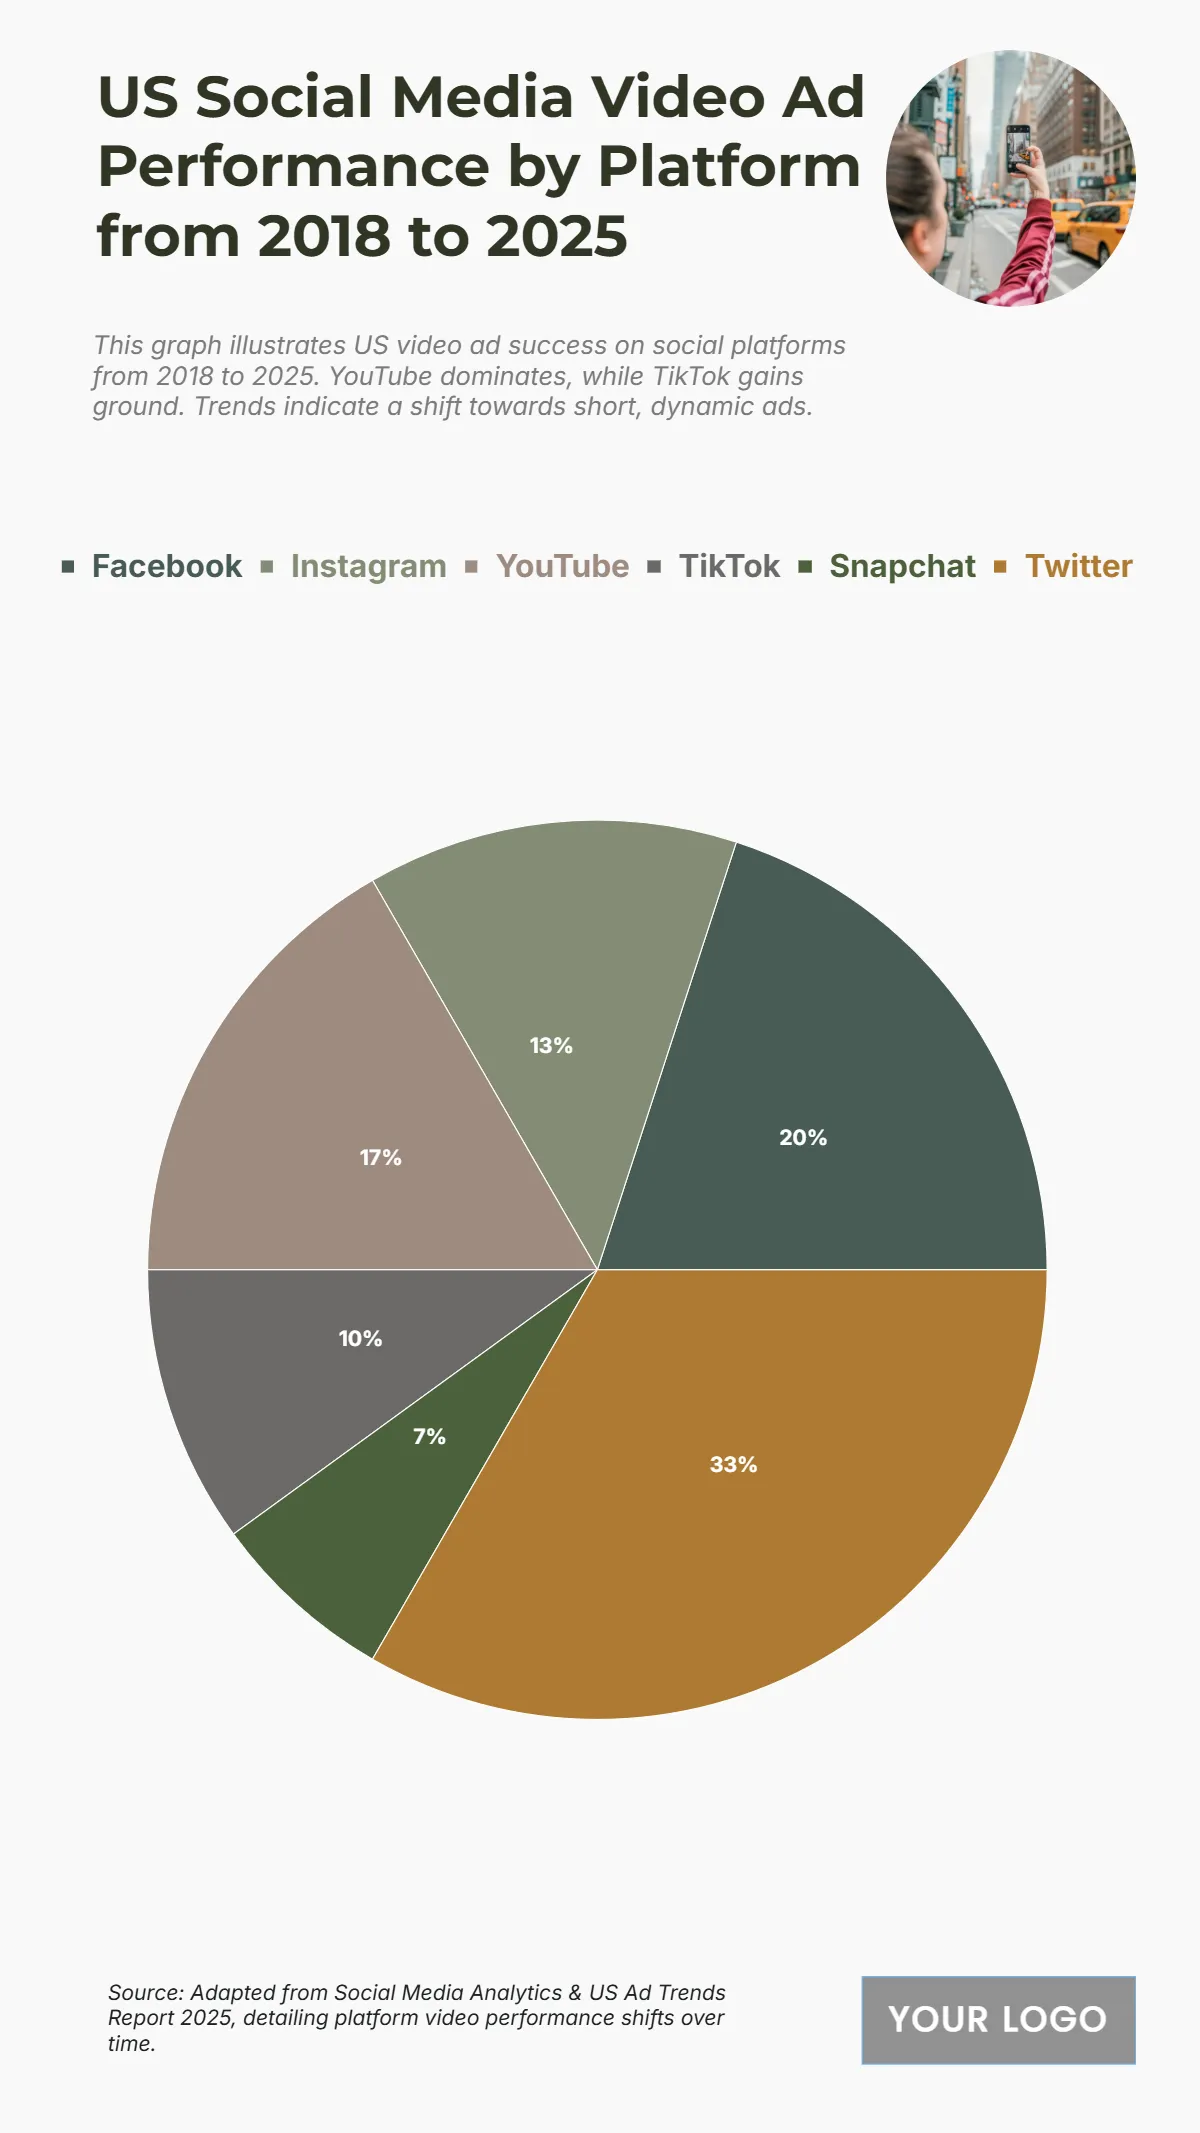
The chart highlights the dominance of YouTube and Twitter in U.S. social media video ad spending between 2018 and 2025. Twitter leads with USD 50 billion in total ad spend, reflecting its strong hold on dynamic, fast-paced video engagement. YouTube follows with USD 25 billion, driven by its global viewership and long-form content profitability. Facebook contributes USD 30 billion, while Instagram records USD 20 billion, reinforcing Meta’s continued presence in the video ad space. TikTok and Snapchat account for USD 15 billion and USD 10 billion, respectively, showcasing their rapid rise through short-form content. This data indicates a shift toward video-dominant advertising, as social platforms evolve into major channels for consumer engagement and brand storytelling.
| Labels | 2018–2025 Ad Spend (Billions) |
|---|---|
| 30 | |
| 20 | |
| YouTube | 25 |
| TikTok | 15 |
| Snapchat | 10 |
| 50 |


