Free US Subscription Platform Ad Revenue Trends from 2020 to 2025 Chart
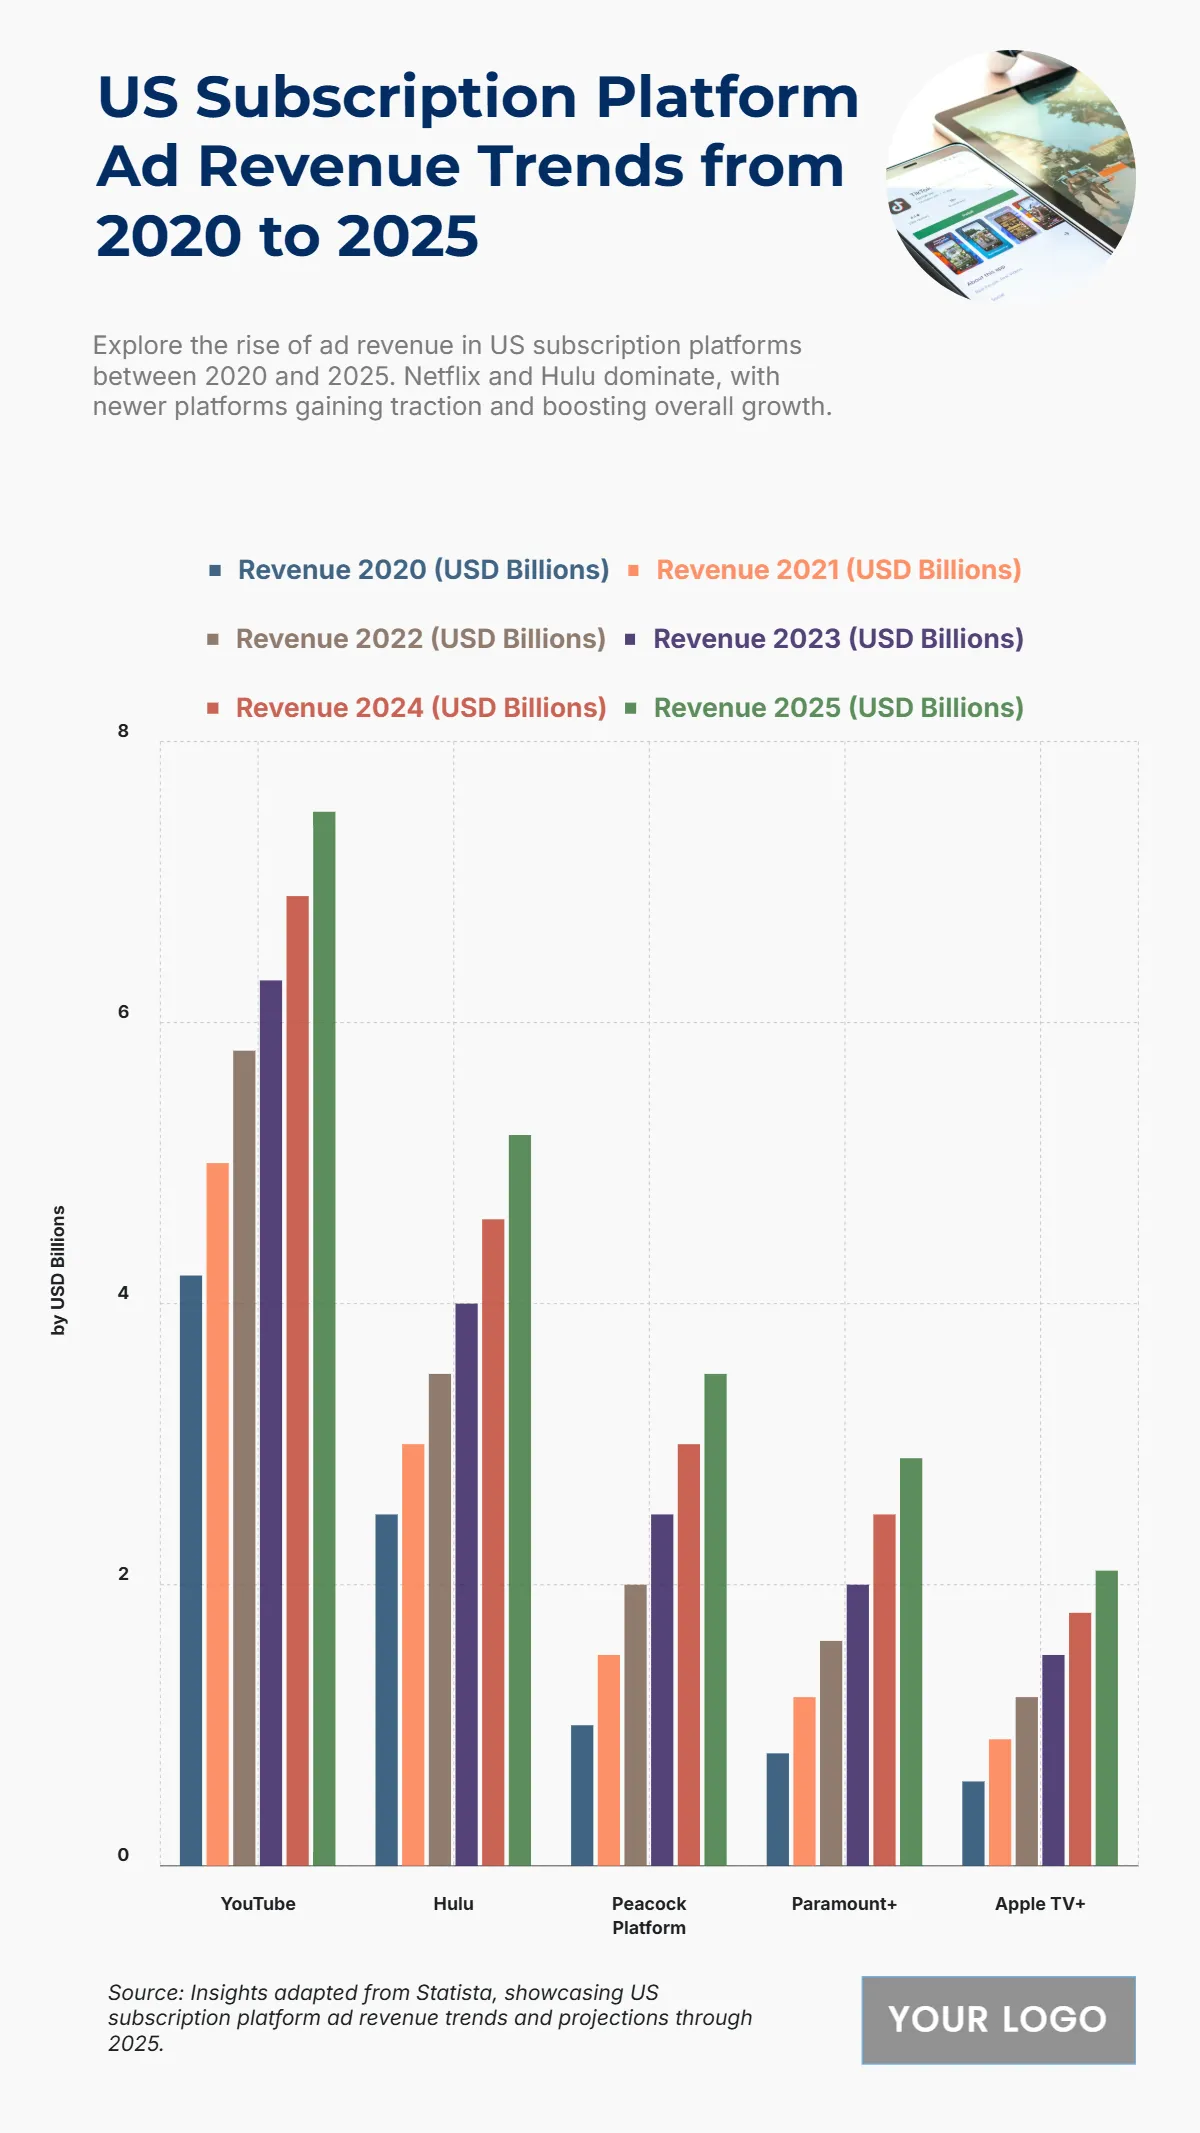
The chart highlights consistent and significant growth in ad revenue across major US subscription platforms from 2020 to 2025. YouTube leads with revenue climbing from USD 4.2 billion in 2020 to USD 7.5 billion in 2025, reflecting its strong position as a top ad-supported platform. Hulu follows with an increase from USD 2.5 billion to USD 5.2 billion, supported by its expanding ad offerings. Peacock grows from USD 1 billion to USD 3.5 billion, Paramount+ from USD 0.8 billion to USD 2.9 billion, and Apple TV+ from USD 0.6 billion to USD 2.1 billion during the same period. This consistent upward trajectory underscores how streaming platforms are increasingly adopting ad-supported models to diversify revenue streams, complementing their subscription-based earnings. It also reflects the surge in advertiser demand for connected TV (CTV) and streaming audiences.
| Labels | 2020 Revenue (USD B) | 2021 Revenue (USD B) | 2022 Revenue (USD B) | 2023 Revenue (USD B) | 2024 Revenue (USD B) | 2025 Revenue (USD B) |
|---|---|---|---|---|---|---|
| YouTube | 4.2 | 5 | 5.8 | 6.3 | 6.9 | 7.5 |
| Hulu | 2.5 | 3 | 3.5 | 4 | 4.6 | 5.2 |
| Peacock | 1 | 1.5 | 2 | 2.5 | 3 | 3.5 |
| Paramount+ | 0.8 | 1.2 | 1.6 | 2 | 2.5 | 2.9 |
| Apple TV+ | 0.6 | 0.9 | 1.2 | 1.5 | 1.8 | 2.1 |


