Free US E-commerce Customer Retention Rate by Category from 2015 to 2025 Chart
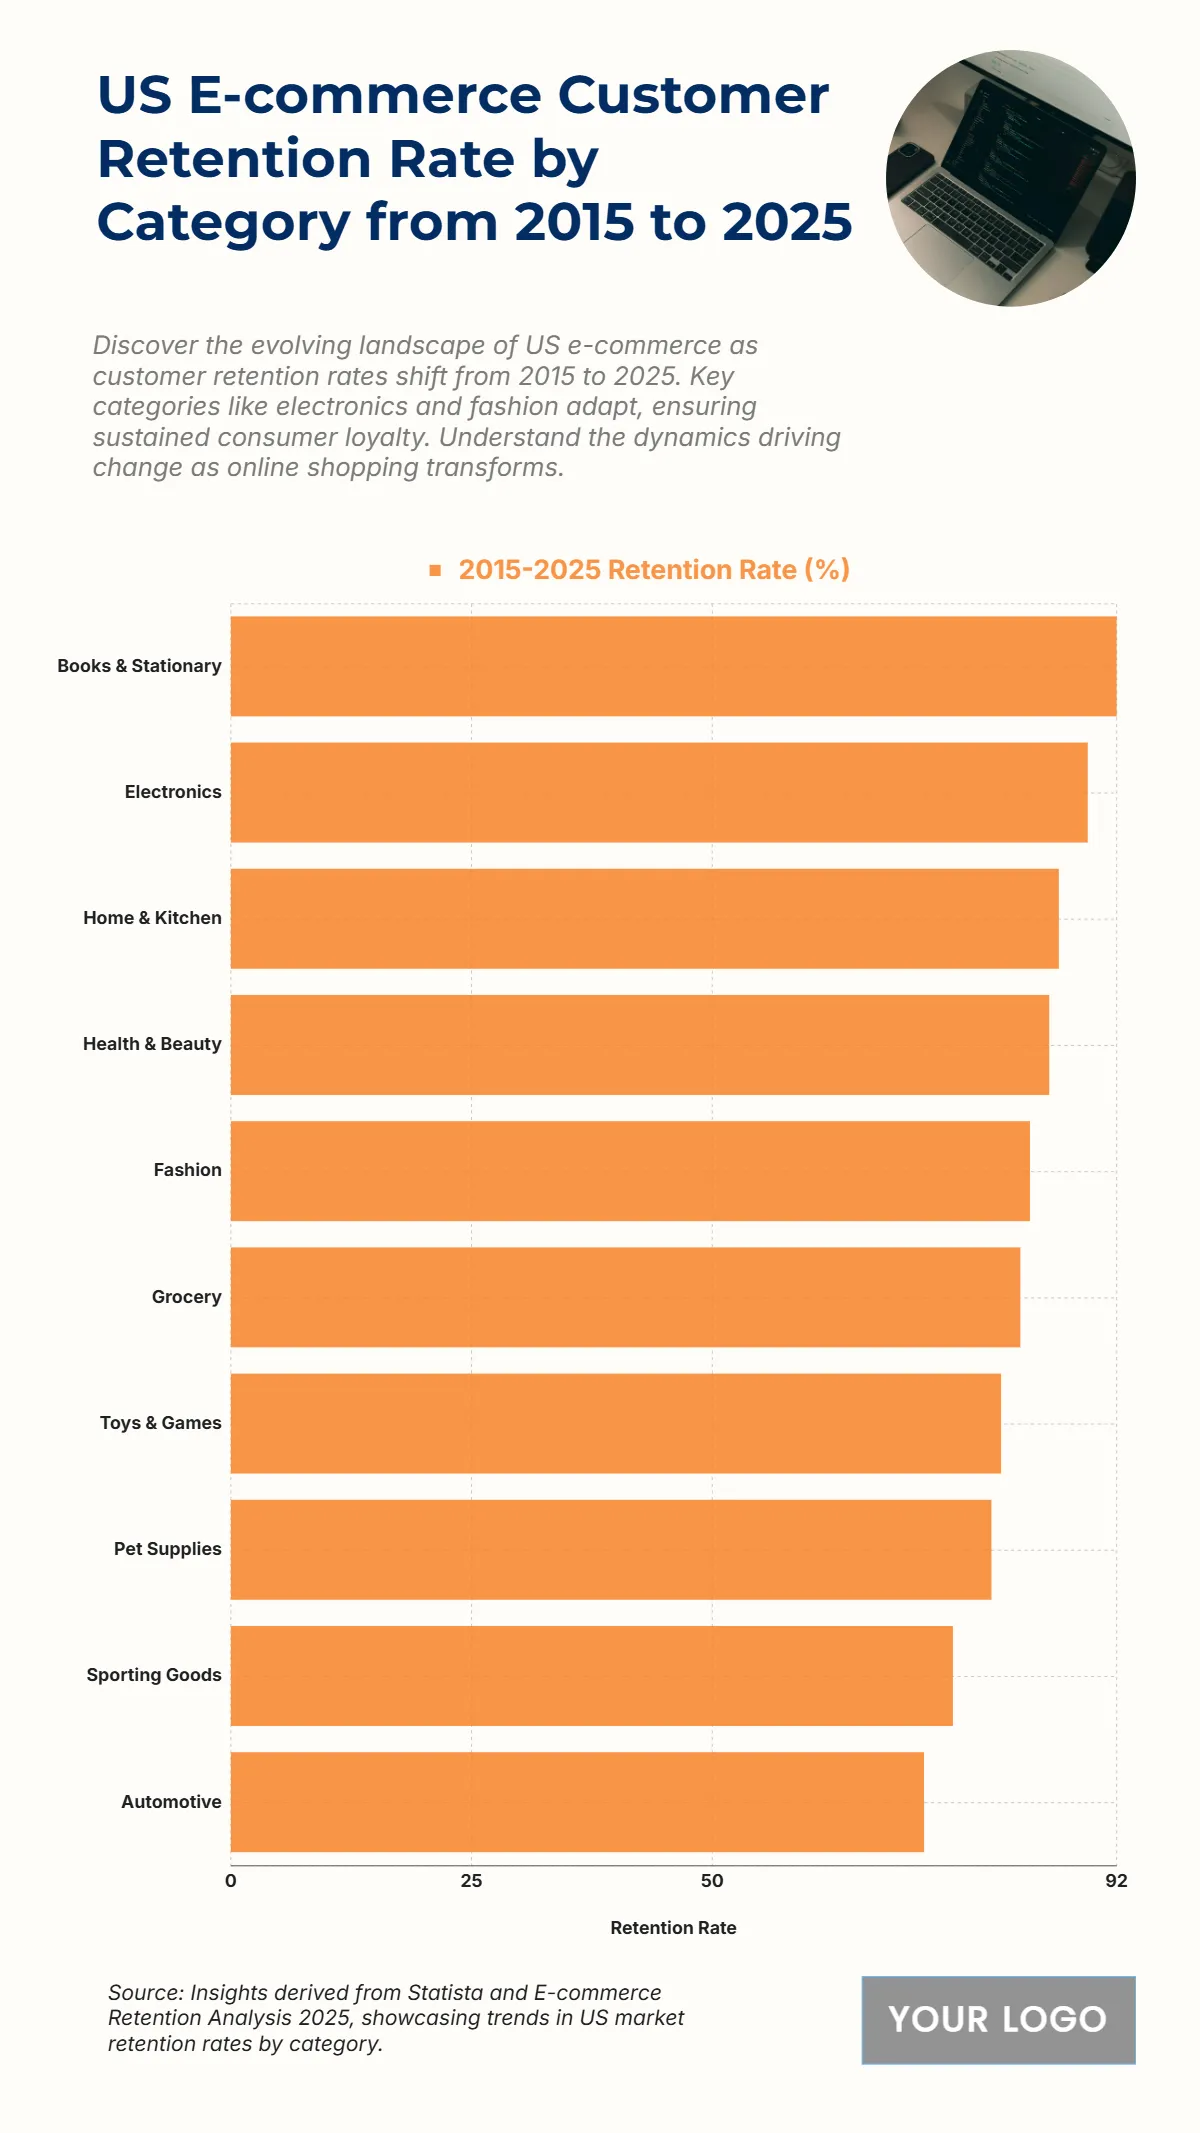
The chart reveals high customer retention rates across key e-commerce categories, with Books & Stationary leading at 92%, followed by Electronics at 89% and Home & Kitchen at 86%. Health & Beauty holds 85%, reflecting stable consumer loyalty. Categories such as Fashion, Grocery, and Toys & Games maintain strong rates above 80%, indicating their essential role in online shopping habits. Lower but notable retention is observed in Pet Supplies (79%), Sporting Goods (75%), and Automotive (72%). These figures demonstrate the strength of recurring purchase behavior in the U.S. e-commerce market, highlighting sectors that have effectively built long-term customer relationships.
| Labels | 2015–2025 Retention Rate (%) |
|---|---|
| Books & Stationary | 92 |
| Electronics | 89 |
| Home & Kitchen | 86 |
| Health & Beauty | 85 |
| Fashion | 83 |
| Grocery | 82 |
| Toys & Games | 80 |
| Pet Supplies | 79 |
| Sporting Goods | 75 |
| Automotive | 72 |


