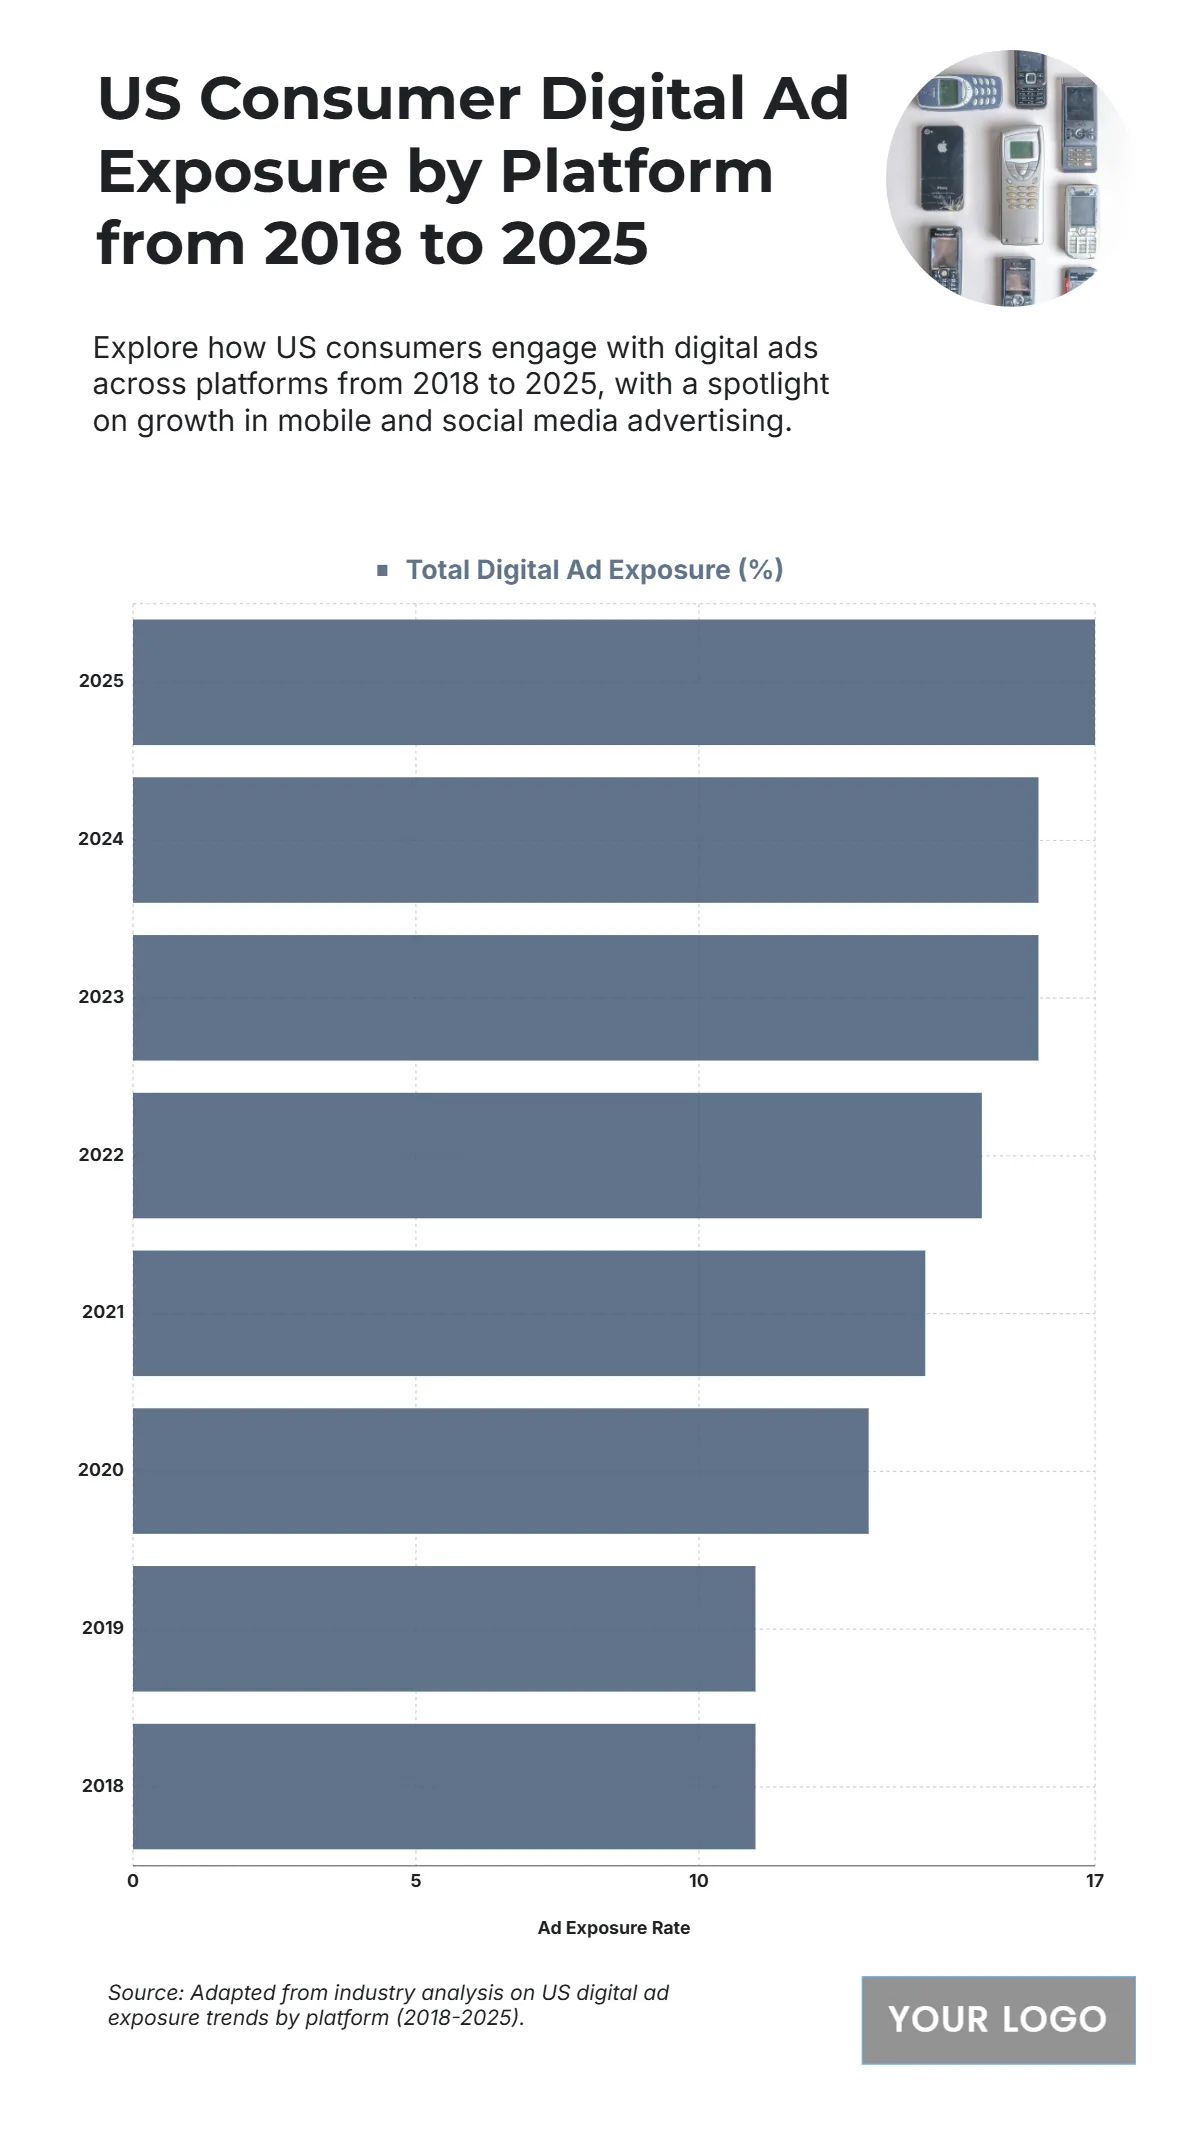
Free US Consumer Digital Ad Exposure by Platform from 2018 to 2025 Chart
The chart shows a steady increase in digital ad exposure among U.S. consumers, growing from 11% in 2018 and 2019 to 17% by 2025. This rise reflects the increased penetration of online platforms and social media in daily life. Key jumps occur post-2020, with exposure reaching 13% in 2020, 15% in 2022, and peaking at 17% in 2025, indicating broader consumer engagement with mobile and digital ad content. The data highlights the central role of digital platforms in advertising strategies, as brands leverage targeting precision, personalization, and omnichannel campaigns to reach audiences where they spend the most time.
| Labels | Total Digital Ad Exposure (%) |
|---|---|
| 2025 | 17 |
| 2024 | 16 |
| 2023 | 16 |
| 2022 | 15 |
| 2021 | 14 |
| 2020 | 13 |
| 2019 | 11 |
| 2018 | 11 |


