Free US Social Media Ad Revenue Growth by Platform from 2015 to 2025 Chart
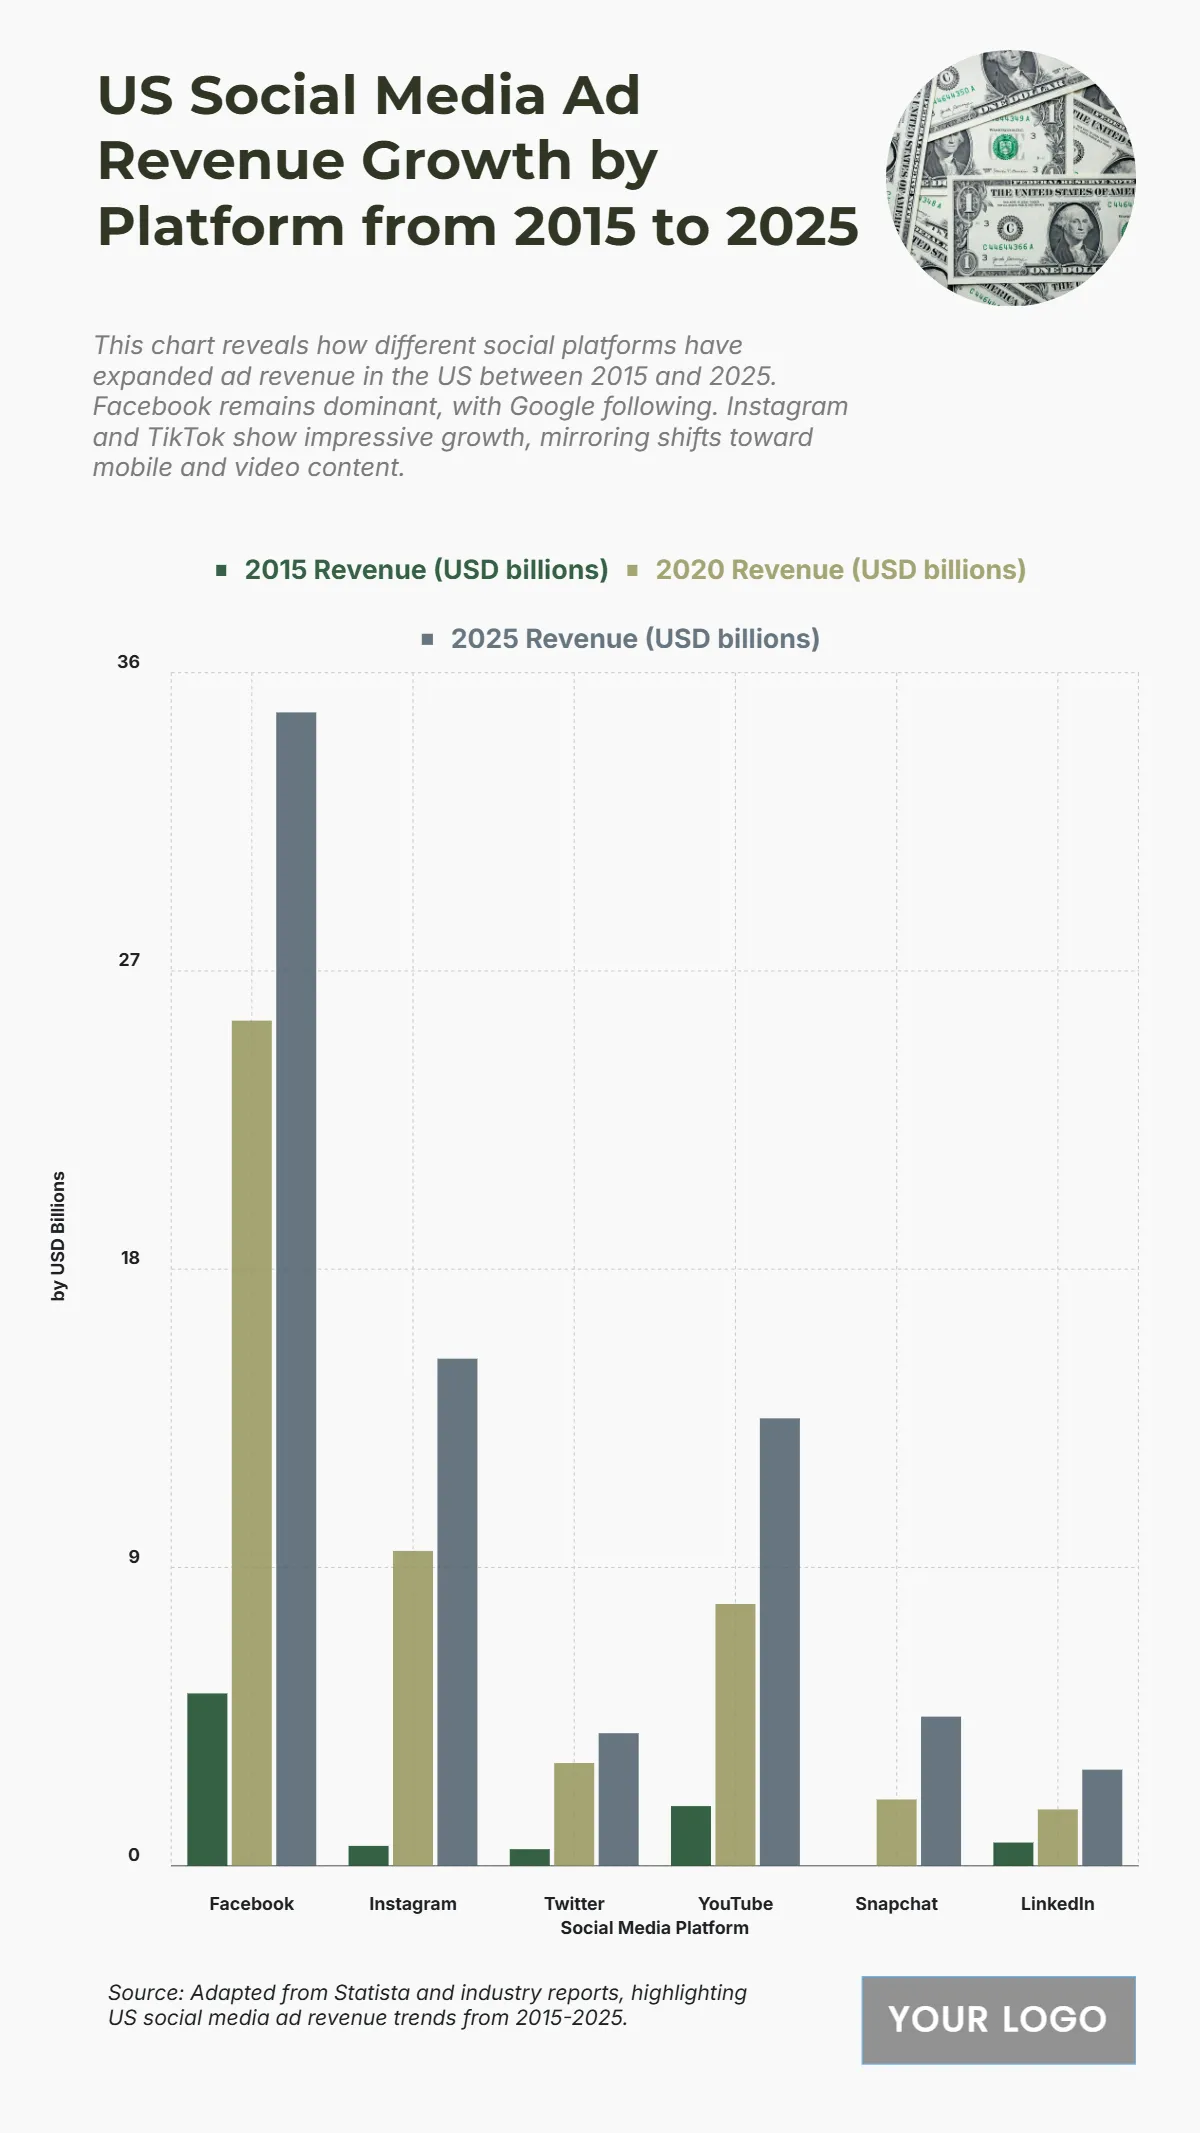
The chart highlights substantial revenue growth across major social media platforms between 2015 and 2025. Facebook leads with a surge from USD 5.2 billion in 2015 to USD 34.8 billion by 2025, showcasing its dominance in the digital ad landscape. Instagram follows at USD 15.3 billion, reflecting its rapid rise as a key ad platform. YouTube reaches USD 13.5 billion, emphasizing the power of video content. Twitter grows steadily to USD 4 billion, while Snapchat and LinkedIn record USD 4.5 billion and USD 2.9 billion, respectively. This steady climb underscores the central role of social media in digital advertising, driven by audience engagement, influencer marketing, and targeted ad formats.
| Labels | 2015 Revenue (USD billions) | 2020 Revenue (USD billions) | 2025 Revenue (USD billions) |
|---|---|---|---|
| 5.2 | 25.5 | 34.8 | |
| 0.6 | 9.5 | 15.3 | |
| 0.5 | 3.1 | 4 | |
| YouTube | 1.8 | 7.9 | 13.5 |
| Snapchat | 0 | 2 | 4.5 |
| 0.7 | 1.7 | 2.9 |


