Free US Online Shopping Preferences by Income Group from 2018 to 2025 Chart
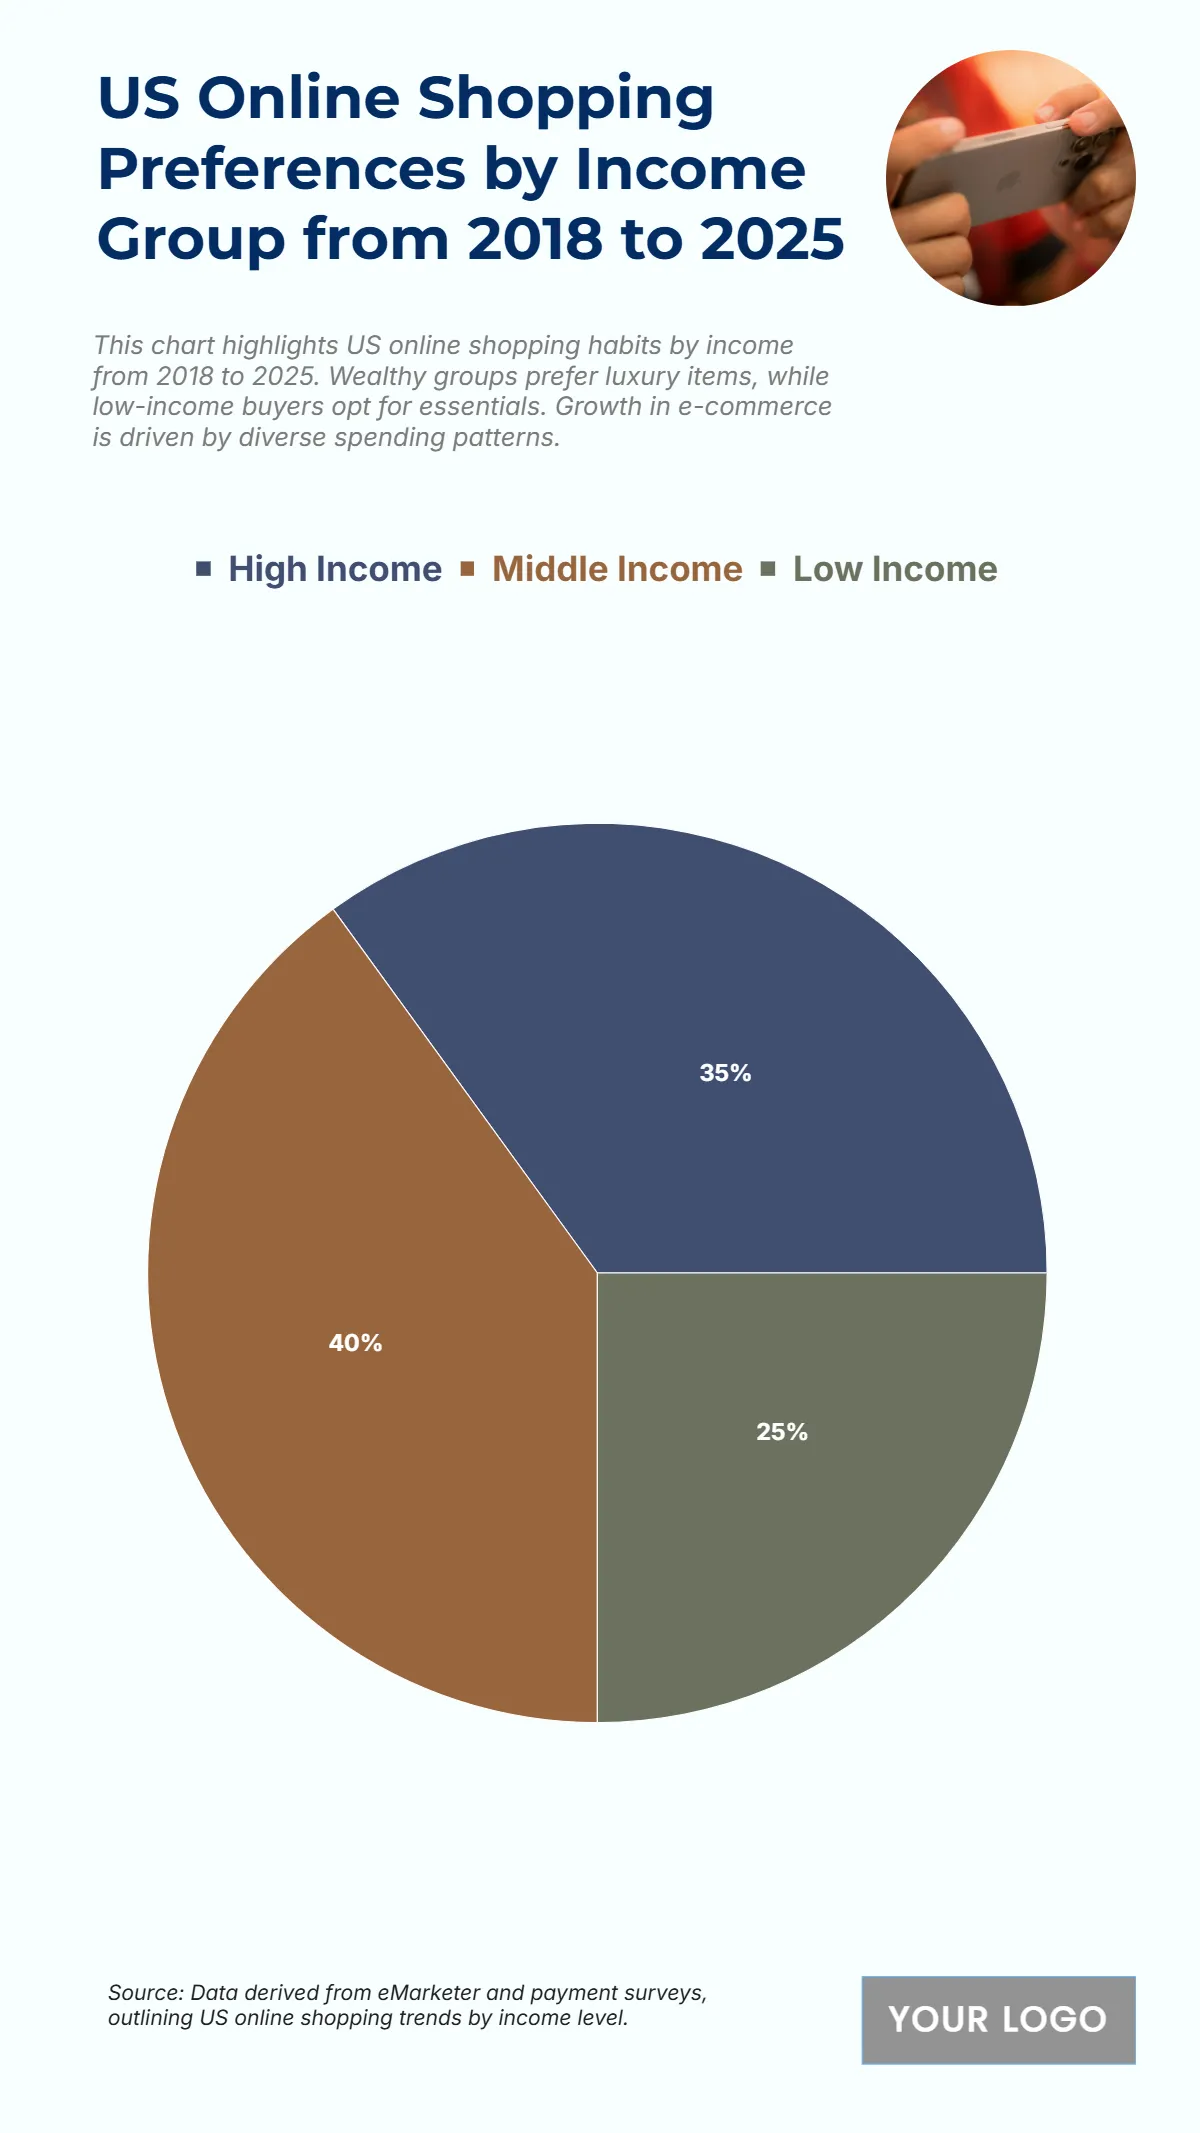
The chart reveals strong engagement in online shopping across income groups, with middle-income consumers leading at 40%, reflecting their balanced purchasing power and adoption of e-commerce. High-income groups account for 35%, often favoring premium and luxury goods, while low-income groups contribute 25%, focusing on essentials and value-driven products. These percentages highlight a diverse e-commerce landscape, where varied spending behaviors shape platform strategies. Retailers target each segment with tailored campaigns, illustrating the growing inclusivity and market penetration of online shopping across all income levels.
| Labels | 2018–2025 Total Rate (%) |
|---|---|
| High Income | 35 |
| Middle Income | 40 |
| Low Income | 25 |


