Free US Streaming Service Subscription vs Ad Revenue from 2020 to 2025 Chart
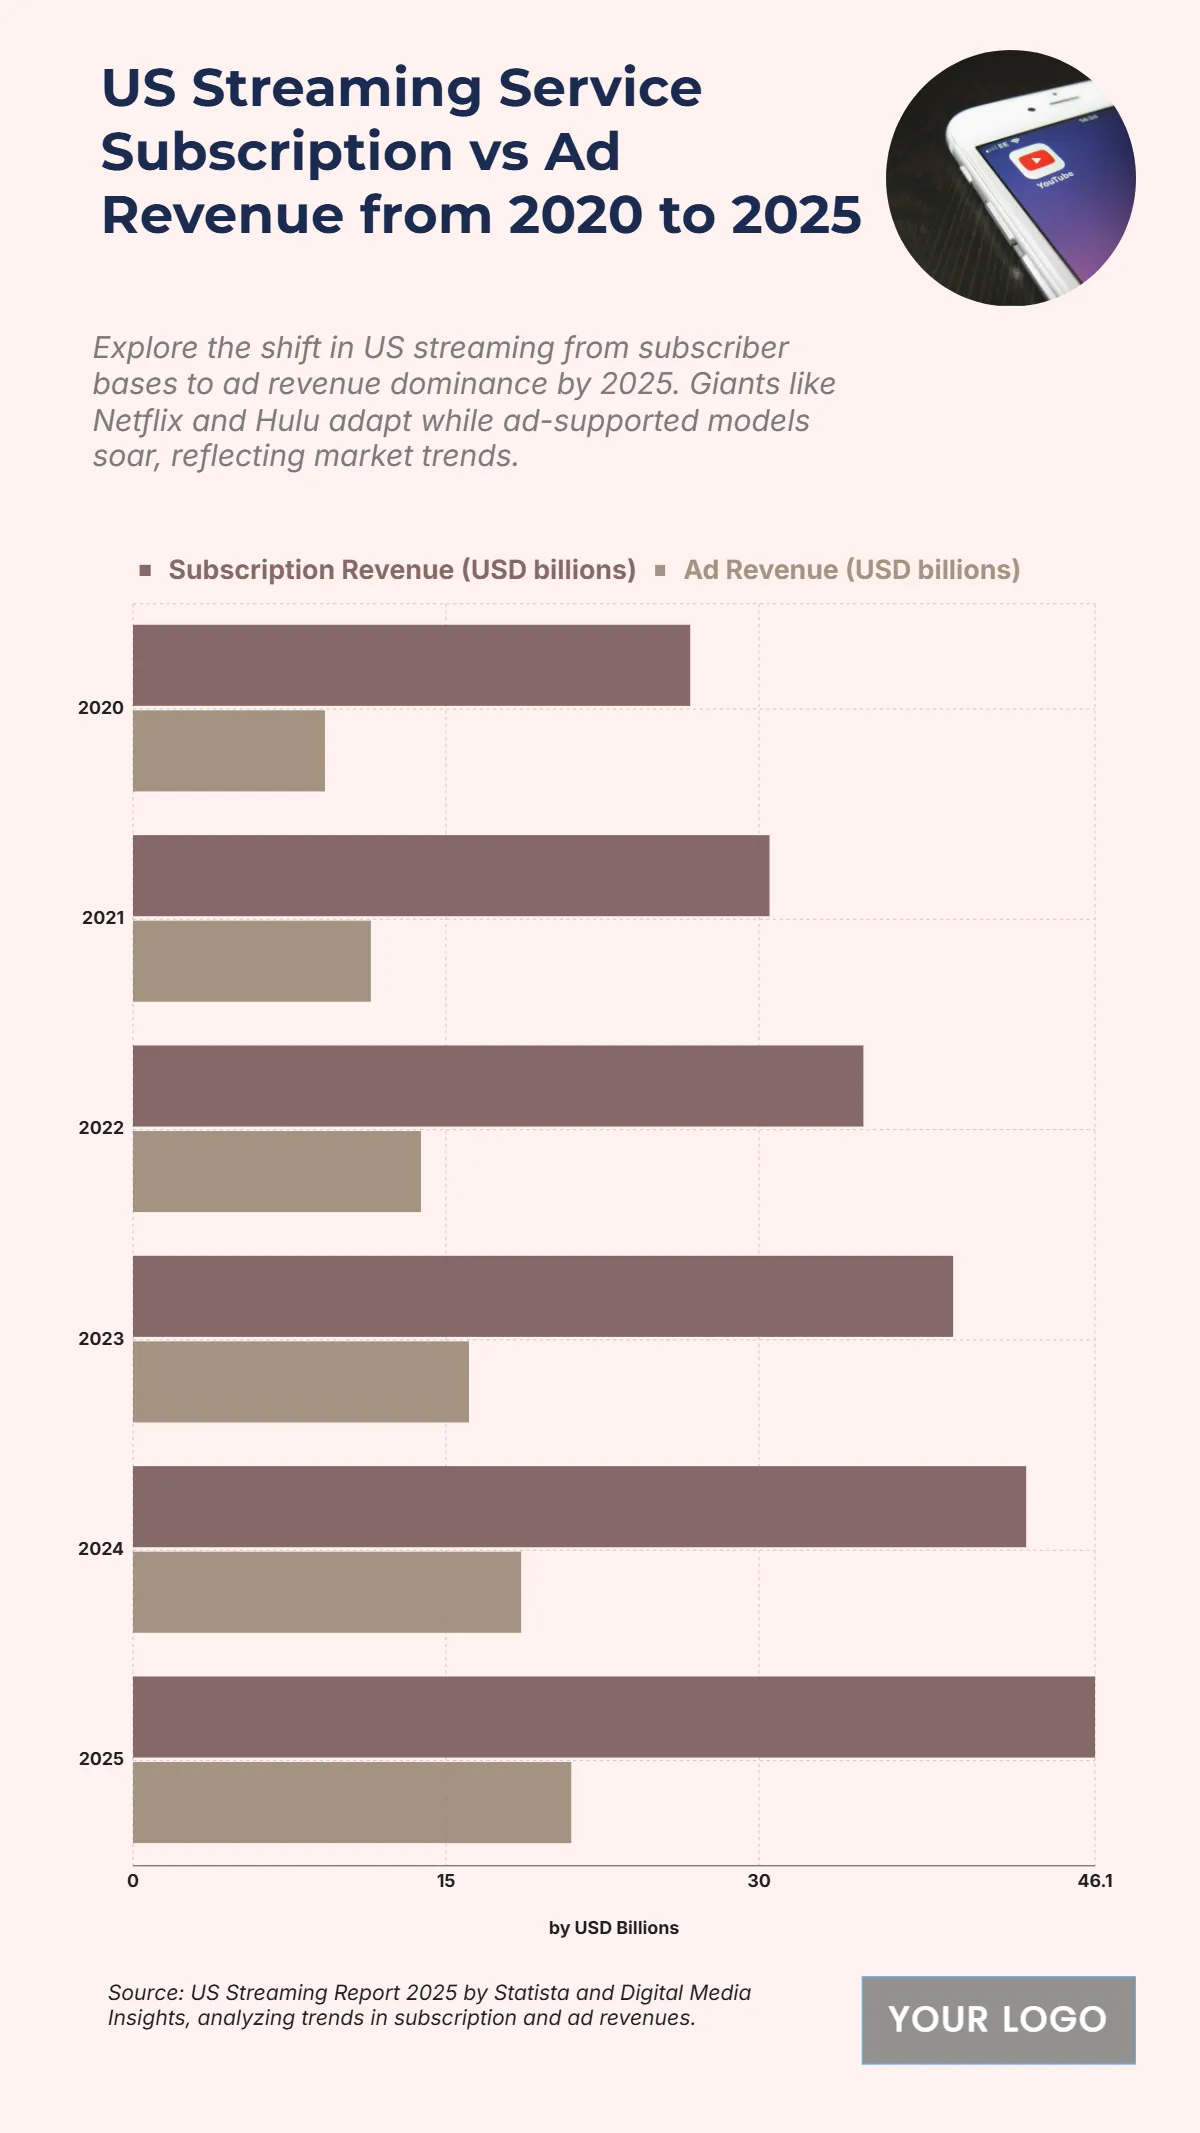
The chart presents a clear upward trend in both subscription and ad revenue for US streaming services from 2020 to 2025. Subscription revenue climbs from USD 26.7 billion in 2020 to USD 46.1 billion in 2025, indicating the continued dominance of subscription-based models. At the same time, ad revenue grows significantly from USD 9.2 billion to USD 21 billion, showcasing the rapid rise of ad-supported tiers and monetization strategies. Notable increases are seen between 2022 (USD 35 billion in subscriptions and USD 13.8 billion in ads) and 2025, where ad revenue nearly doubles compared to 2020. This simultaneous growth highlights a hybrid revenue model strategy, with streaming platforms increasingly relying on both subscribers and advertisers to maximize profitability.
| Labels | Subscription Revenue (USD billions) | Ad Revenue (USD billions) |
|---|---|---|
| 2020 | 26.7 | 9.2 |
| 2021 | 30.5 | 11.4 |
| 2022 | 35 | 13.8 |
| 2023 | 39.3 | 16.1 |
| 2024 | 42.8 | 18.6 |
| 2025 | 46.1 | 21 |


