Free US E-commerce Advertising Effectiveness by Industry from 2015 to 2025 Chart
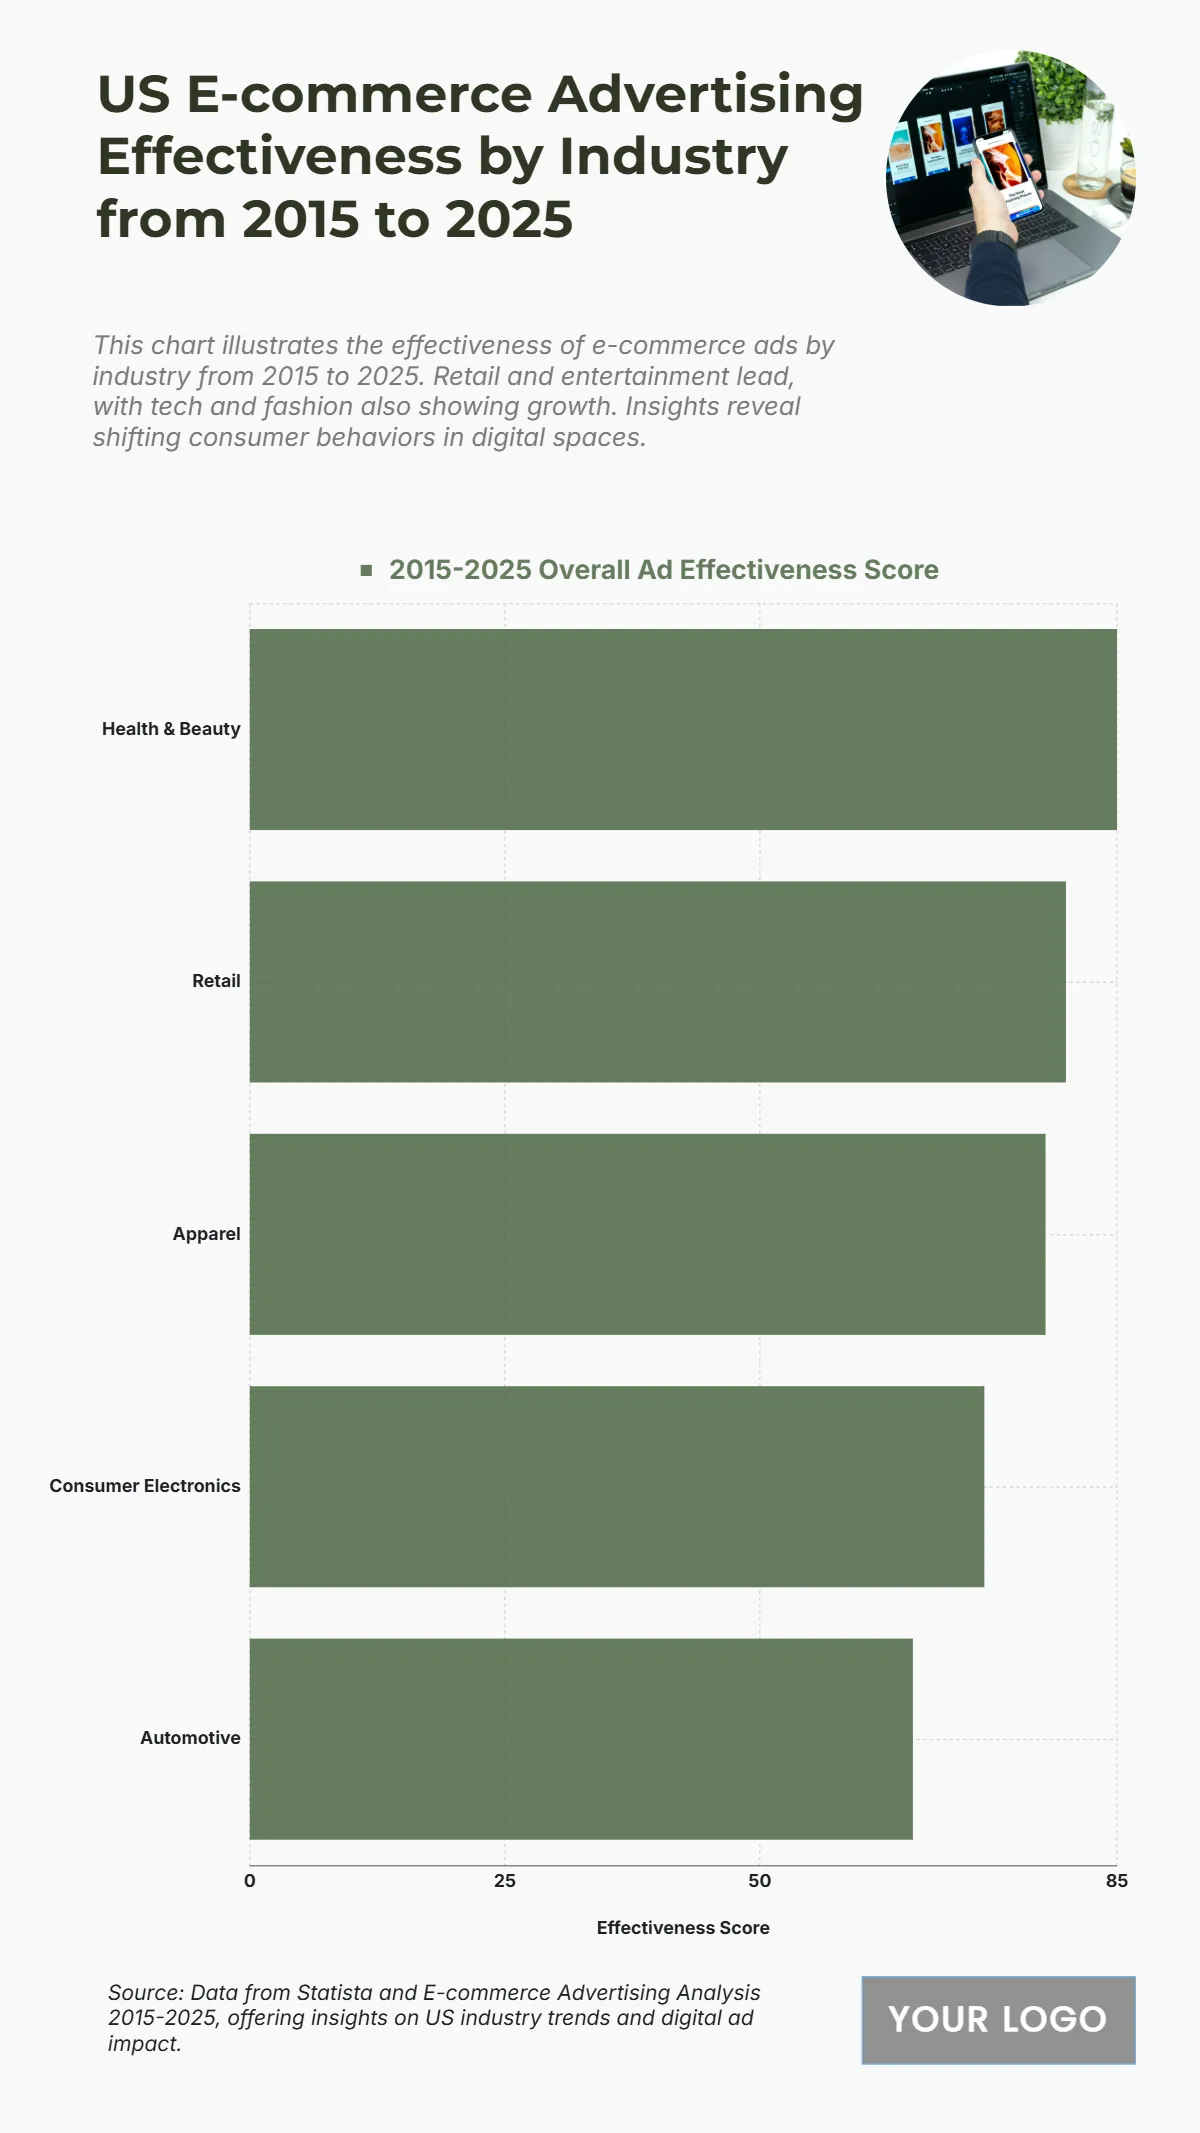
The chart highlights how e-commerce advertising effectiveness varies by industry, with Health & Beauty leading at a score of 85, underscoring strong consumer engagement and conversion rates. Retail follows closely at 80, showing solid performance across omnichannel campaigns. Apparel scores 78, reflecting its consistent traction in digital advertising, particularly through social media and influencer strategies. Consumer Electronics scores 72, indicating steady but moderate engagement, while Automotive ranks lowest at 65, likely due to longer consumer decision cycles. Overall, the data emphasizes the strong performance of lifestyle and retail categories in digital advertising, driven by personalization, fast conversion funnels, and high online shopping activity.
| Labels | 2015–2025 Overall Ad Effectiveness Score |
|---|---|
| Health & Beauty | 85 |
| Retail | 80 |
| Apparel | 78 |
| Consumer Electronics | 72 |
| Automotive | 65 |


