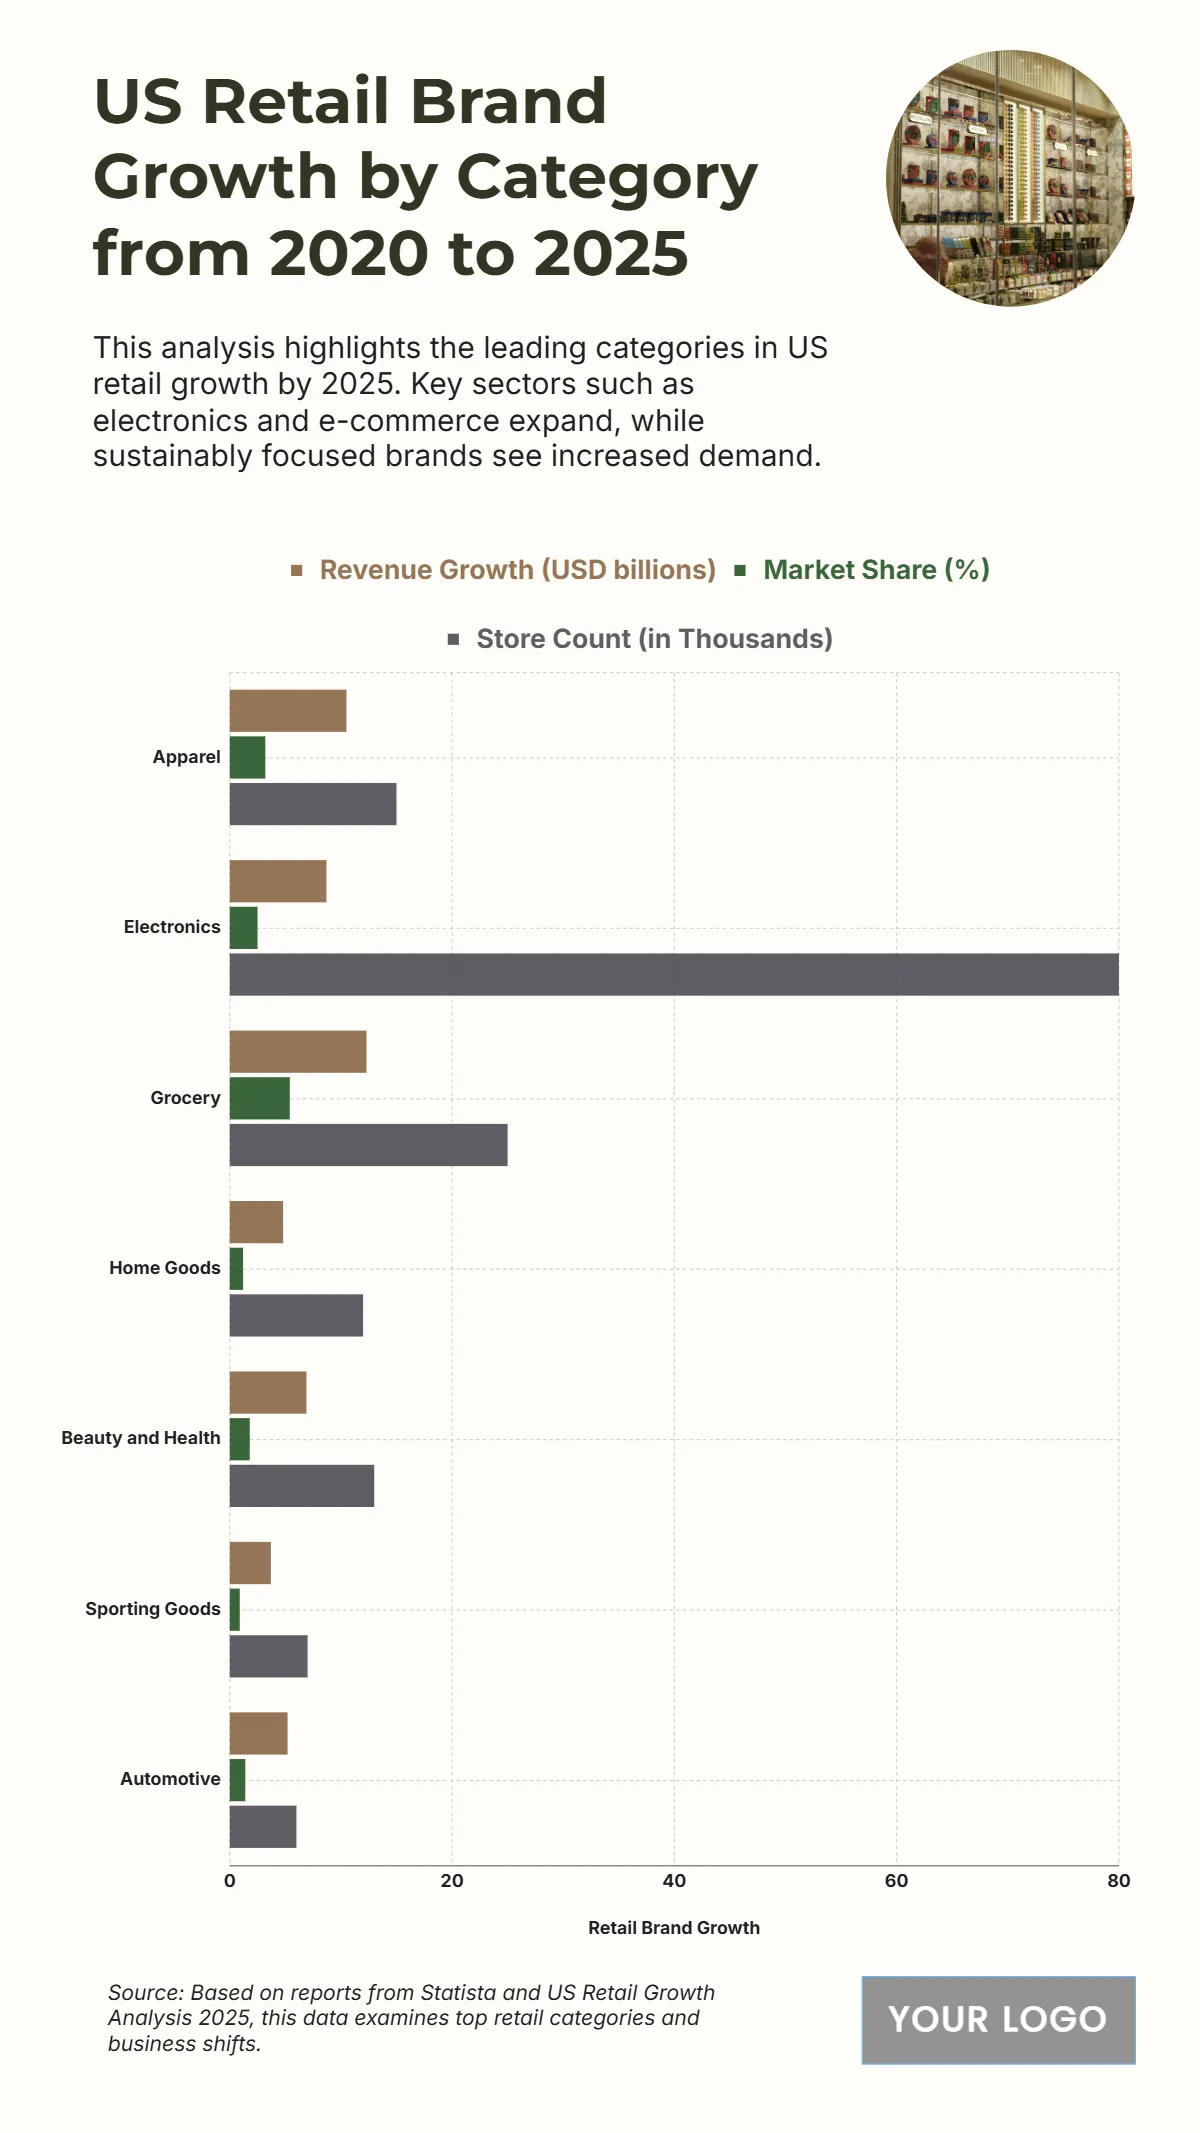
Free US Retail Brand Growth by Category from 2020 to 2025 Chart
The chart indicates Grocery as the top category with USD 12.3 billion in revenue growth and a 5.4% market share, supported by a 25,000-store count, reflecting consumer reliance on essential retail. Apparel follows with USD 10.5 billion, showing strength in fashion retail, while Electronics leads in store count with 80,000 locations and USD 8.7 billion in revenue growth, highlighting its broad reach. Beauty and Health (USD 6.9B), Home Goods (USD 4.8B), Automotive (USD 5.2B), and Sporting Goods (USD 3.7B) contribute moderate but significant growth. This distribution underscores how essential and lifestyle sectors dominate retail expansion, while specialized categories maintain stable market shares.
| Labels | Revenue Growth (USD billions) | Market Share (%) | Store Count (in Thousands) |
|---|---|---|---|
| Apparel | 10.5 | 3.2 | 15 |
| Electronics | 8.7 | 2.5 | 80 |
| Grocery | 12.3 | 5.4 | 25 |
| Home Goods | 4.8 | 1.2 | 12 |
| Beauty and Health | 6.9 | 1.8 | 13 |
| Sporting Goods | 3.7 | 0.9 | 7 |
| Automotive | 5.2 | 1.4 | 6 |


