Free US Online Advertising Revenue by Quarter from 2015 to 2025 Chart
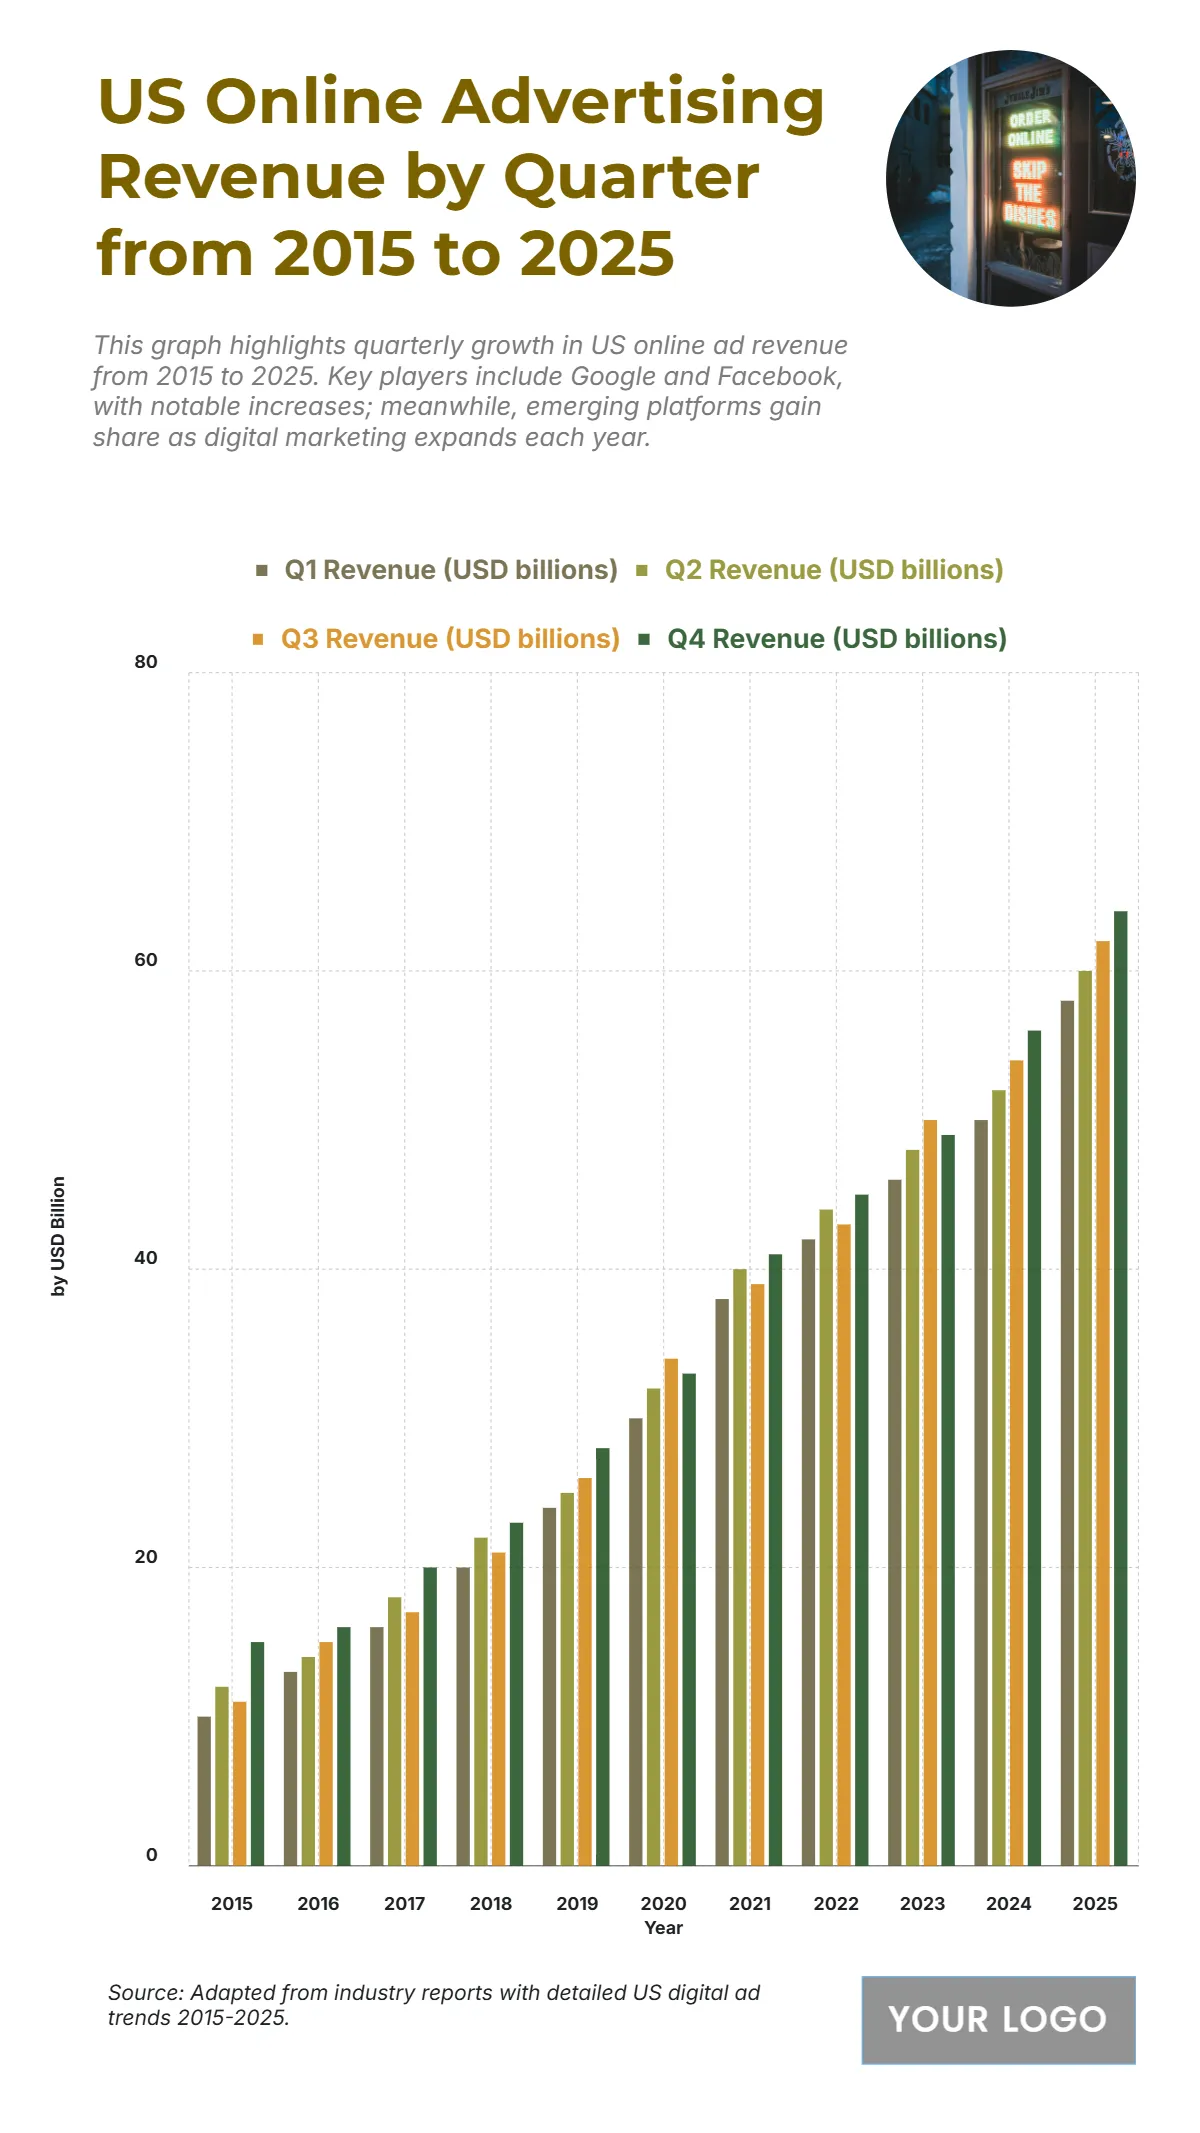
The chart demonstrates a steady and substantial growth in online advertising revenue across all quarters, increasing from USD 10–15 billion in 2015 to USD 58–64 billion in 2025. Q4 consistently records the highest revenue, reaching USD 64 billion, likely due to holiday season marketing spikes and year-end ad campaigns. Q2 and Q3 follow closely at USD 60 and 62 billion, while Q1 marks a strong USD 58 billion. This consistent upward trajectory underscores the expanding dominance of digital advertising, driven by increased online engagement, targeted ad strategies, and seasonal promotional cycles that maximize advertiser ROI.
| Labels | Q1 Revenue (USD B) | Q2 Revenue (USD B) | Q3 Revenue (USD B) | Q4 Revenue (USD B) |
|---|---|---|---|---|
| 2015 | 10 | 12 | 11 | 15 |
| 2016 | 13 | 14 | 15 | 16 |
| 2017 | 16 | 18 | 17 | 20 |
| 2018 | 20 | 22 | 21 | 23 |
| 2019 | 24 | 25 | 26 | 28 |
| 2020 | 30 | 32 | 34 | 33 |
| 2021 | 38 | 40 | 39 | 41 |
| 2022 | 42 | 44 | 43 | 45 |
| 2023 | 46 | 48 | 50 | 49 |
| 2024 | 50 | 52 | 54 | 56 |
| 2025 | 58 | 60 | 62 | 64 |


