Free US Streaming Ad Spend vs Subscriber Growth from 2015 to 2025 Chart
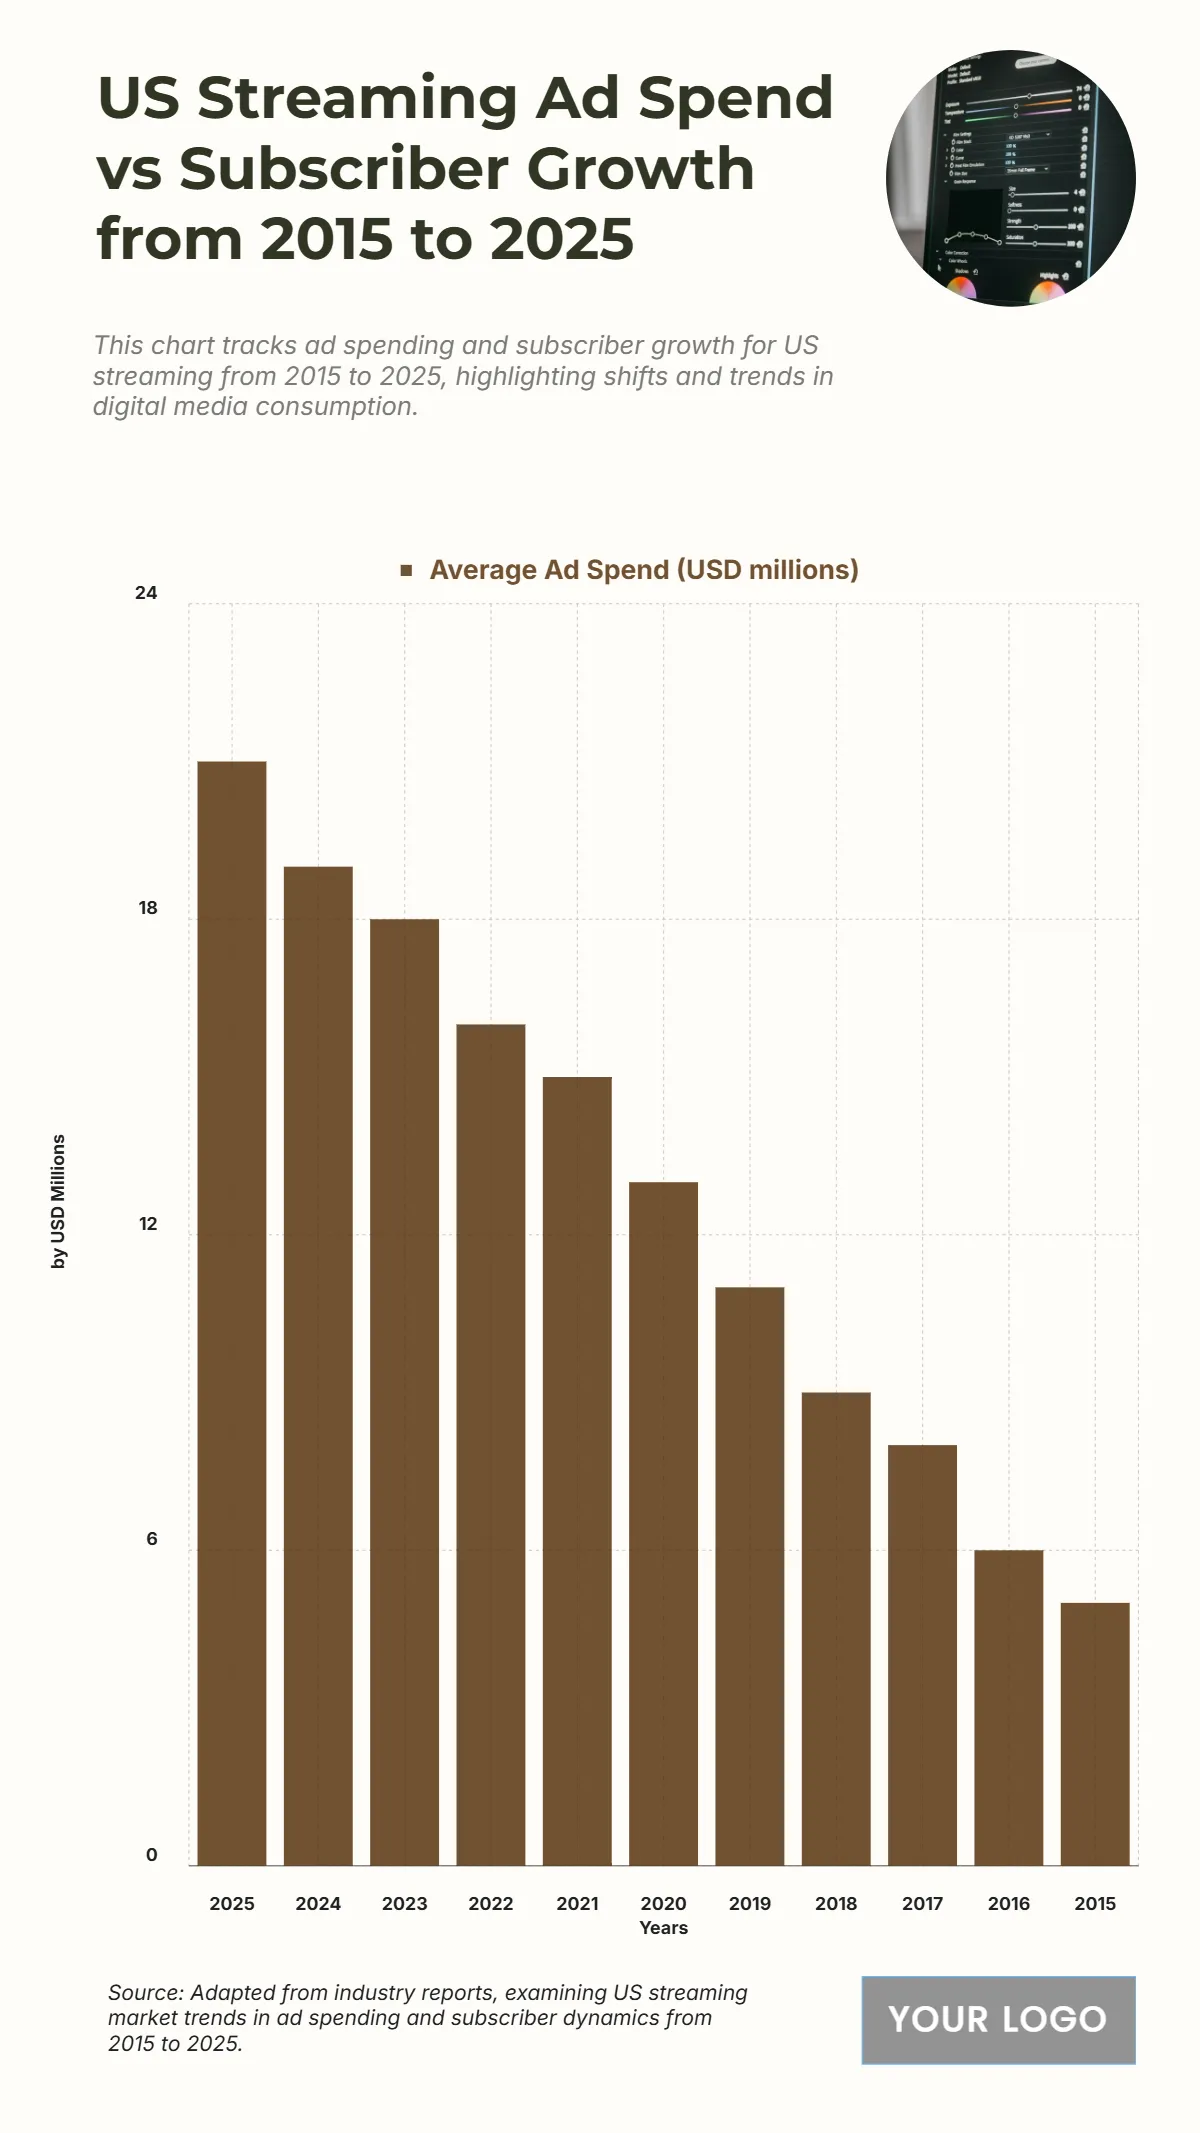
The chart shows a steady and significant increase in streaming ad spend over the decade, rising from USD 5 million in 2015 to USD 21 million in 2025. This steady climb reflects the expansion of the digital streaming market and growing advertiser investment in platforms to capture audiences. Spending doubles from USD 10 million in 2017 to USD 21 million in 2025, with major jumps after 2019, coinciding with the streaming boom. 2020 marks USD 13 million, followed by continued annual increases reaching USD 19 million in 2024 and peaking at USD 21 million in 2025. This growth trend highlights the strong correlation between rising streaming subscriptions and increased ad spending, emphasizing the shift of marketing budgets toward digital entertainment platforms.
| Labels | Average Ad Spend (USD millions) |
|---|---|
| 2025 | 21 |
| 2024 | 19 |
| 2023 | 18 |
| 2022 | 16 |
| 2021 | 15 |
| 2020 | 13 |
| 2019 | 11 |
| 2018 | 9 |
| 2017 | 8 |
| 2016 | 6 |
| 2015 | 5 |


