Free US Retail Campaign Performance by Objective from 2020 to 2025 Chart
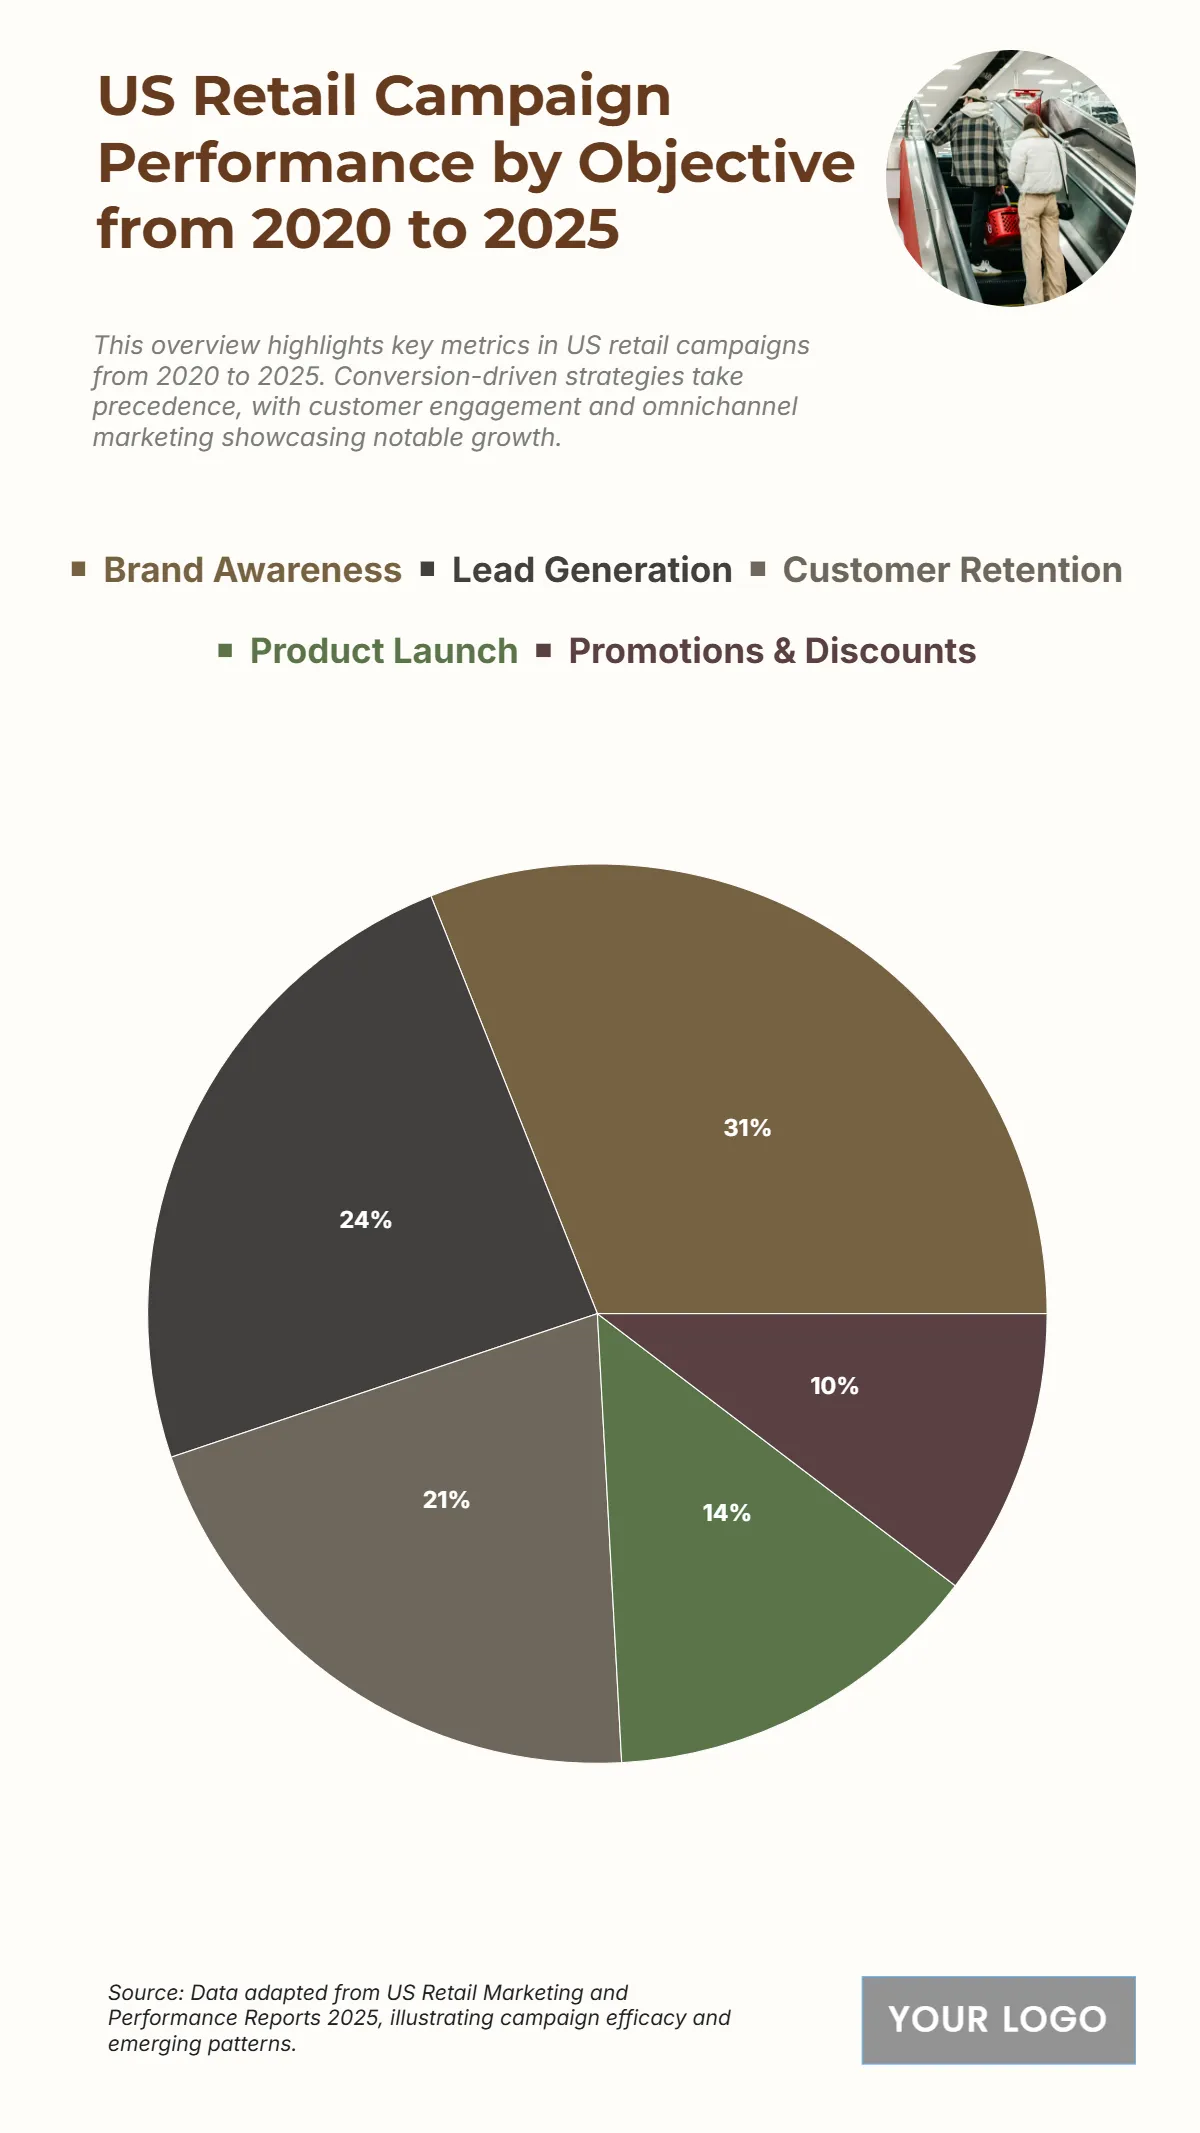
The chart displays the US Retail Campaign Performance by Objective from 2020 to 2025 as a percentage of total investment, highlighting the strategic priorities for marketing spend. Brand Awareness receives the largest share of total investment at 31% or 45 billion USD. Lead Generation and Customer Retention are the next most significant objectives, with Lead Generation at 24% or 35 billion USD and Customer Retention at 21% or 30 billion USD. Product Launch accounts for 14% or 20 billion USD of the total investment. Promotions & Discounts receives the smallest share, with 10% or 15 billion USD. The data shows that over half of the investment ($\mathbf{55\%}$) is dedicated to top-of-funnel activities, namely Brand Awareness and Lead Generation, indicating that US retail campaigns prioritize growing their customer base and visibility.
| Labels | 2020–2025 Total Investment (USD Billions) |
| Brand Awareness | 45 |
| Lead Generation | 35 |
| Customer Retention | 30 |
| Product Launch | 20 |
| Promotions & Discounts | 15 |


