Free US Online Purchase Intent by Category from 2015 to 2025 Chart
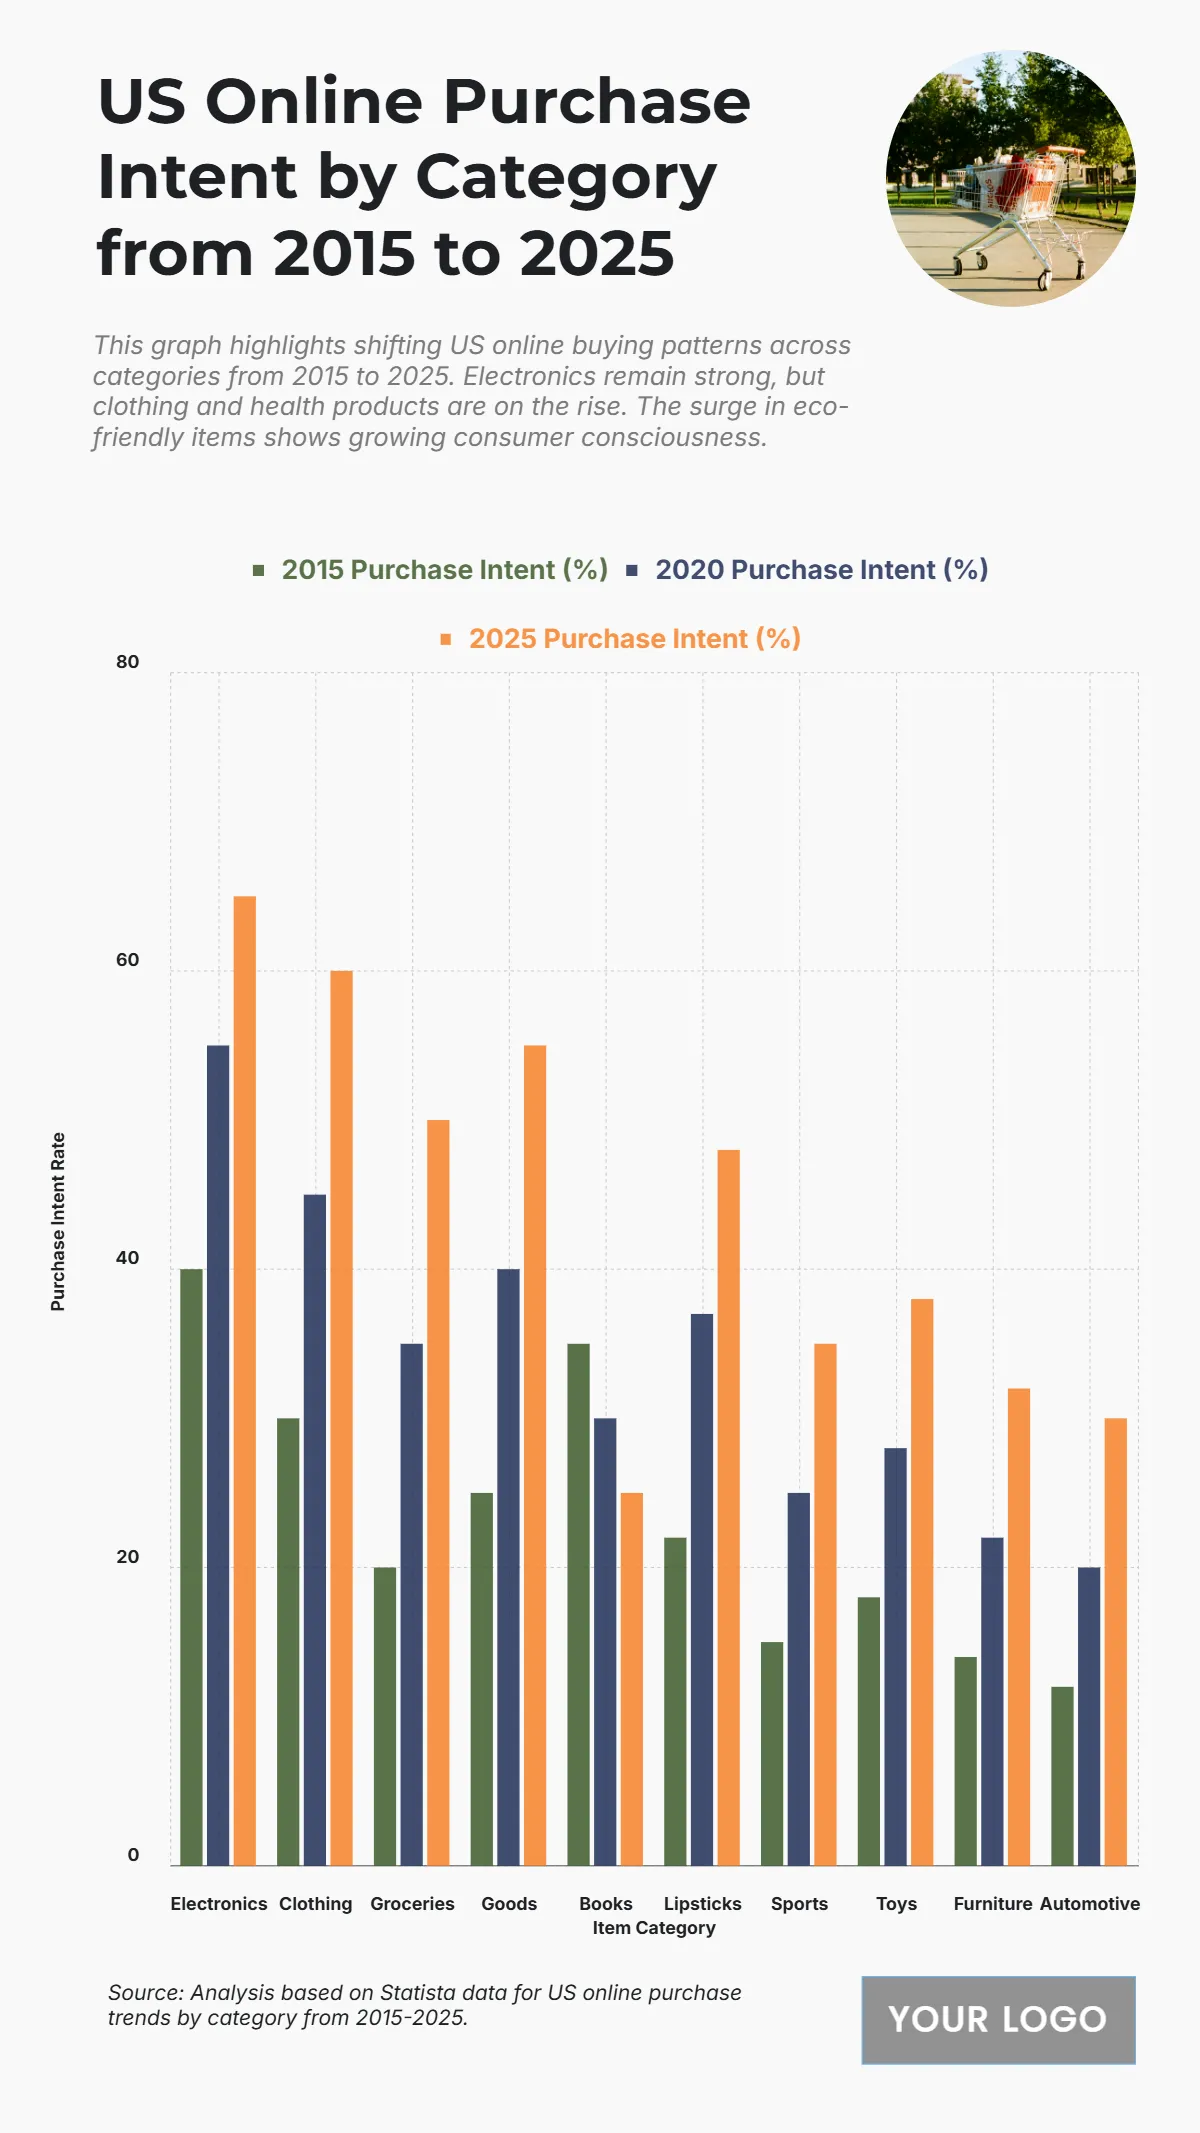
The chart displays the US Online Purchase Intent (%) by category from 2015 to 2025, illustrating a general increase in intent across most categories over the decade, with Electronics consistently holding the highest intent. Electronics purchase intent rose from 40% in 2015 to 55% in 2020, and is projected to reach 65% in 2025. Clothing follows a similar trajectory, increasing from 30% in 2015 to 45% in 2020, with a projected intent of 60% in 2025. Groceries saw a sharp increase, jumping from 20% in 2015 to a projected 50% in 2025. The only category showing a decline is Books, dropping from 35% in 2015 to 30% in 2020, and projected to fall further to 25% in 2025. The categories with the lowest intent in 2025 are Automotive at 30% and Furniture at 32%.
| Labels | 2015 Purchase Intent (%) | 2020 Purchase Intent (%) | 2025 Purchase Intent (%) |
| Electronics | 40 | 55 | 65 |
| Clothing | 30 | 45 | 60 |
| Groceries | 20 | 35 | 50 |
| Goods | 25 | 40 | 55 |
| Books | 35 | 30 | 25 |
| Lipsticks | 22 | 37 | 48 |
| Sports | 15 | 25 | 35 |
| Toys | 18 | 28 | 38 |
| Furniture | 14 | 22 | 32 |
| Automotive | 12 | 20 | 30 |


