Free US Video Platform Advertising ROI by Device from 2015 to 2025 Chart
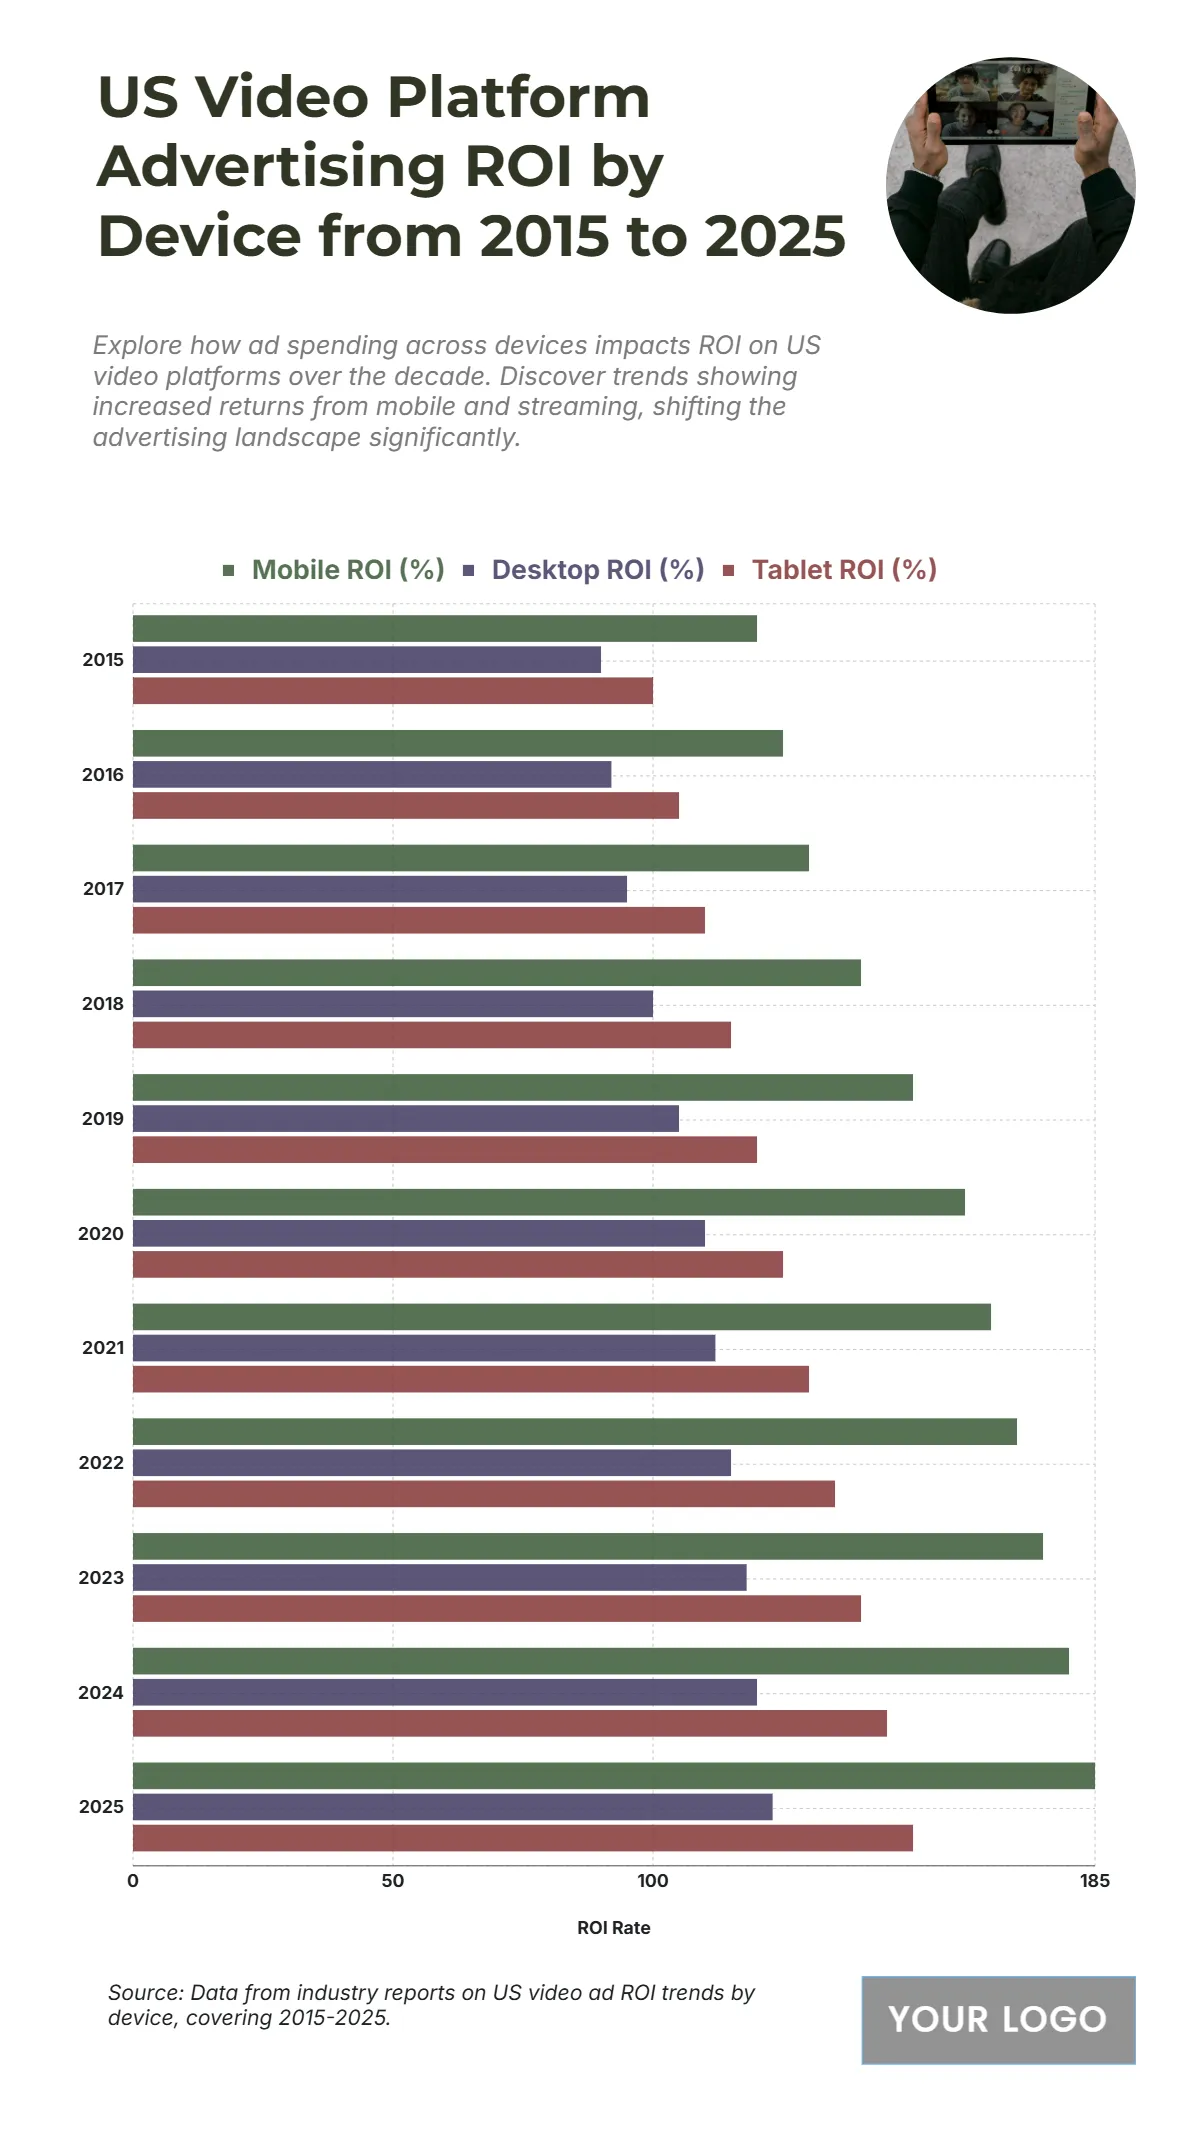
The chart displays the US Video Platform Advertising ROI (%) by device from 2015 to 2025, showing that Mobile consistently generates the highest ROI, followed by Tablet, with Desktop having the lowest ROI across the entire decade. Mobile ROI (%) started at 120% in 2015 and steadily increased to a projected 185% in 2025. Tablet ROI (%) began at 100% in 2015 and is projected to reach 145% in 2025. Desktop ROI (%) had the lowest starting point at 90% in 2015 and is projected to reach 123% in 2025. The gap between Mobile and Desktop ROI (%) widened significantly, increasing from 30 percentage points in 2015 ($\mathbf{120\% - 90\% = 30\%}$) to 62 percentage points in 2025 ($\mathbf{185\% - 123\% = 62\%}$), confirming the growing dominance of Mobile devices for video ad returns.
| Labels | Mobile ROI (%) | Desktop ROI (%) | Tablet ROI (%) |
| 2015 | 120 | 90 | 100 |
| 2016 | 125 | 92 | 105 |
| 2017 | 130 | 95 | 110 |
| 2018 | 140 | 100 | 115 |
| 2019 | 150 | 105 | 120 |
| 2020 | 160 | 110 | 125 |
| 2021 | 165 | 112 | 130 |
| 2022 | 170 | 115 | 135 |
| 2023 | 175 | 118 | 140 |
| 2024 | 180 | 120 | 145 |
| 2025 | 185 | 123 | 150 |


