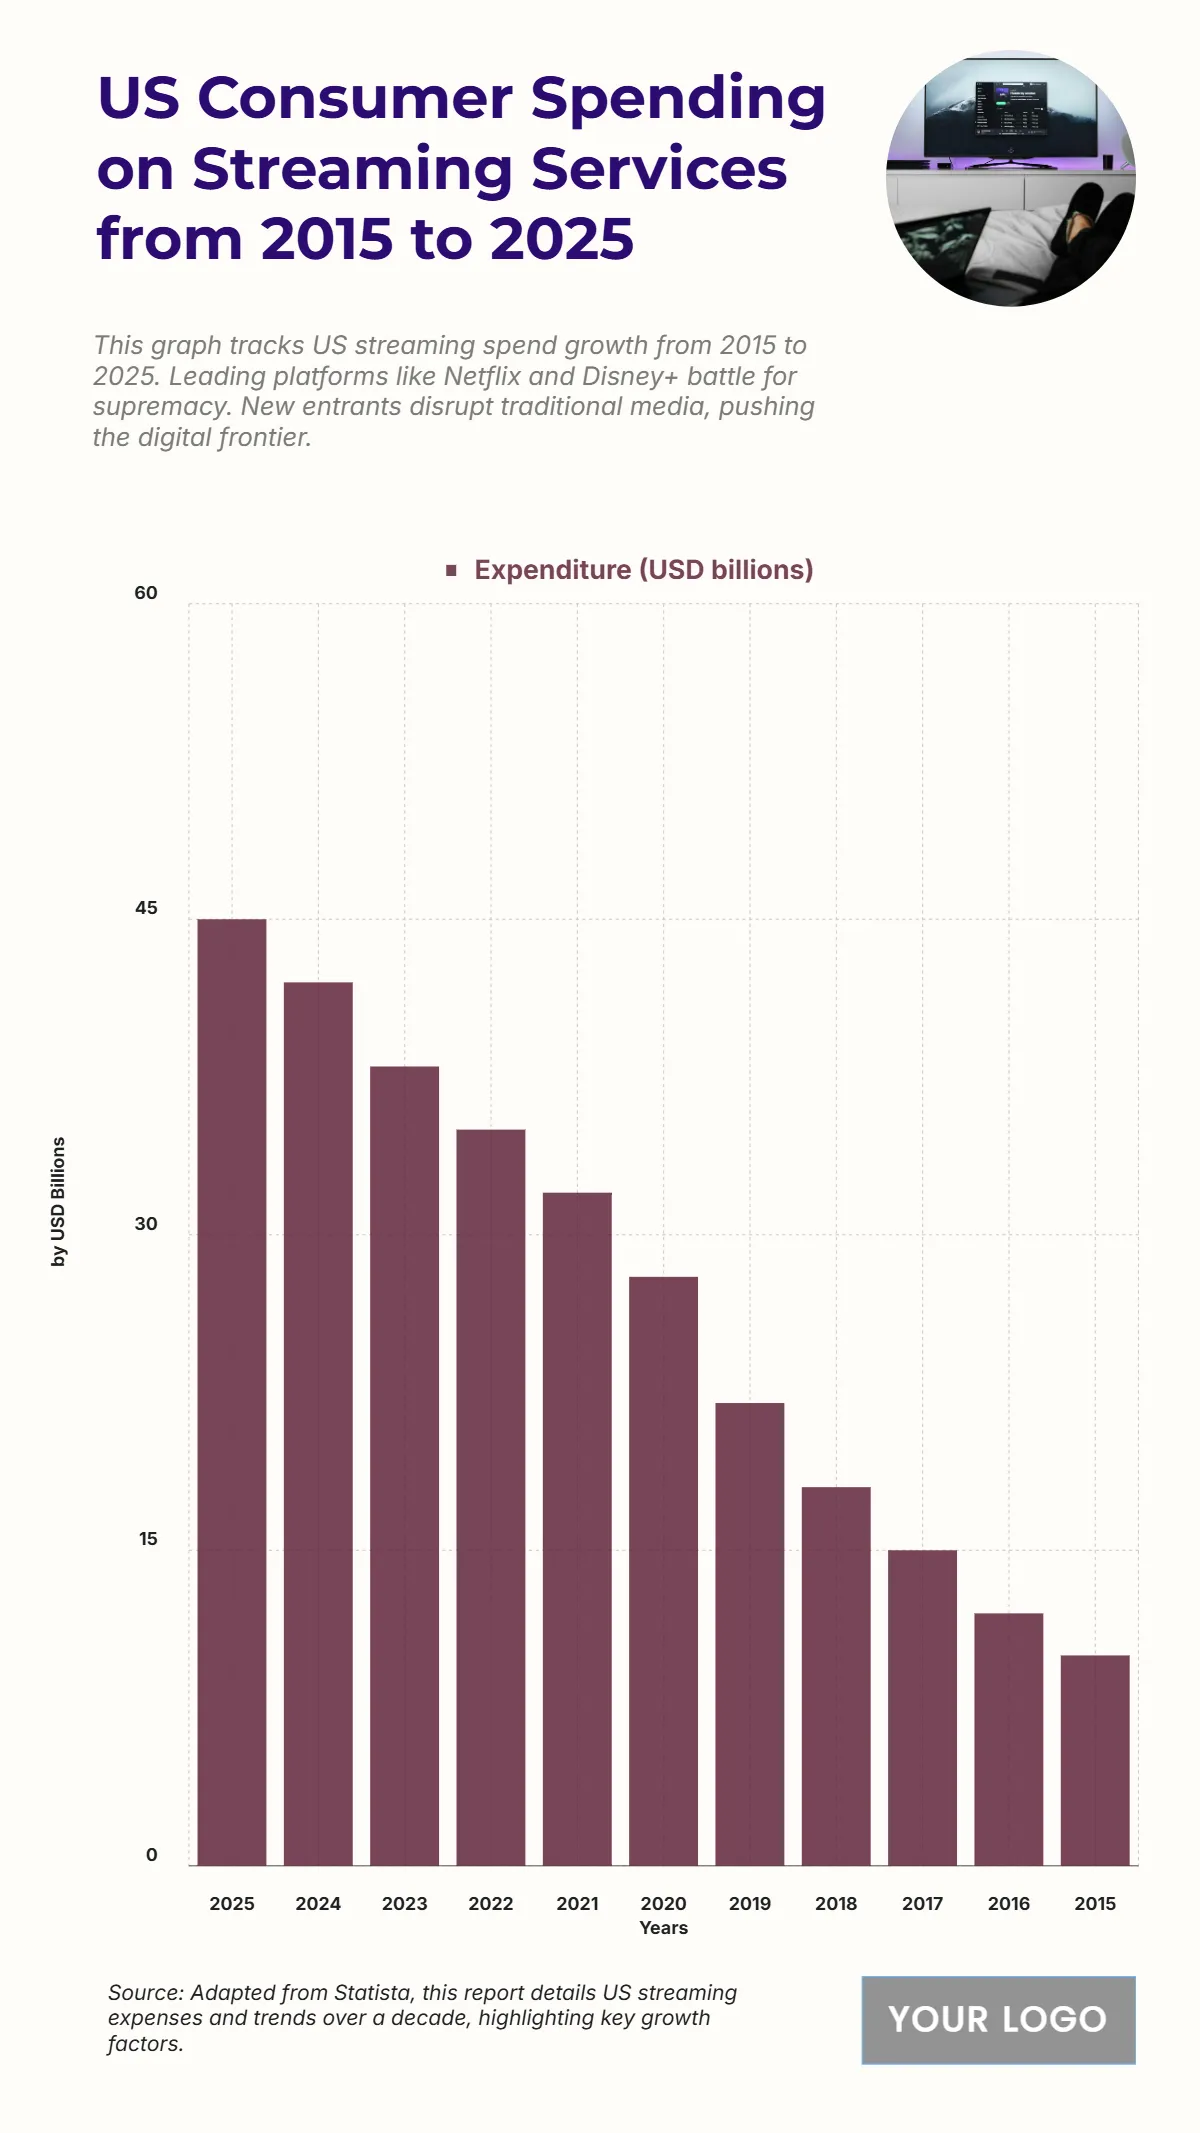
Free US Consumer Spending on Streaming Services from 2015 to 2025 Chart
The chart displays the US Consumer Spending on Streaming Services as Expenditure (USD billions) from 2015 to 2025, illustrating a dramatic and continuous upward trend over the decade. The expenditure started at its lowest point in 2015 with 10 billion USD. It then increased to 12 billion USD in 2016, 15 billion USD in 2017, 18 billion USD in 2018, and 22 billion USD in 2019. The growth accelerated, reaching 28 billion USD in 2020, 32 billion USD in 2021, and 35 billion USD in 2022. The expenditure is projected to be 38 billion USD in 2023, 42 billion USD in 2024, and peak at 45 billion USD in 2025. This represents a staggering 35 billion USD increase, or a 450% growth, in consumer spending on streaming services from 2015 to 2025, underscoring the shift of entertainment consumption to digital platforms.
| Labels | Expenditure (USD billions) |
| 2025 | 45 |
| 2024 | 42 |
| 2023 | 38 |
| 2022 | 35 |
| 2021 | 32 |
| 2020 | 28 |
| 2019 | 22 |
| 2018 | 18 |
| 2017 | 15 |
| 2016 | 12 |
| 2015 | 10 |


