Free US Online Marketplace Ad Spend by Product Type from 2020 to 2025 Chart
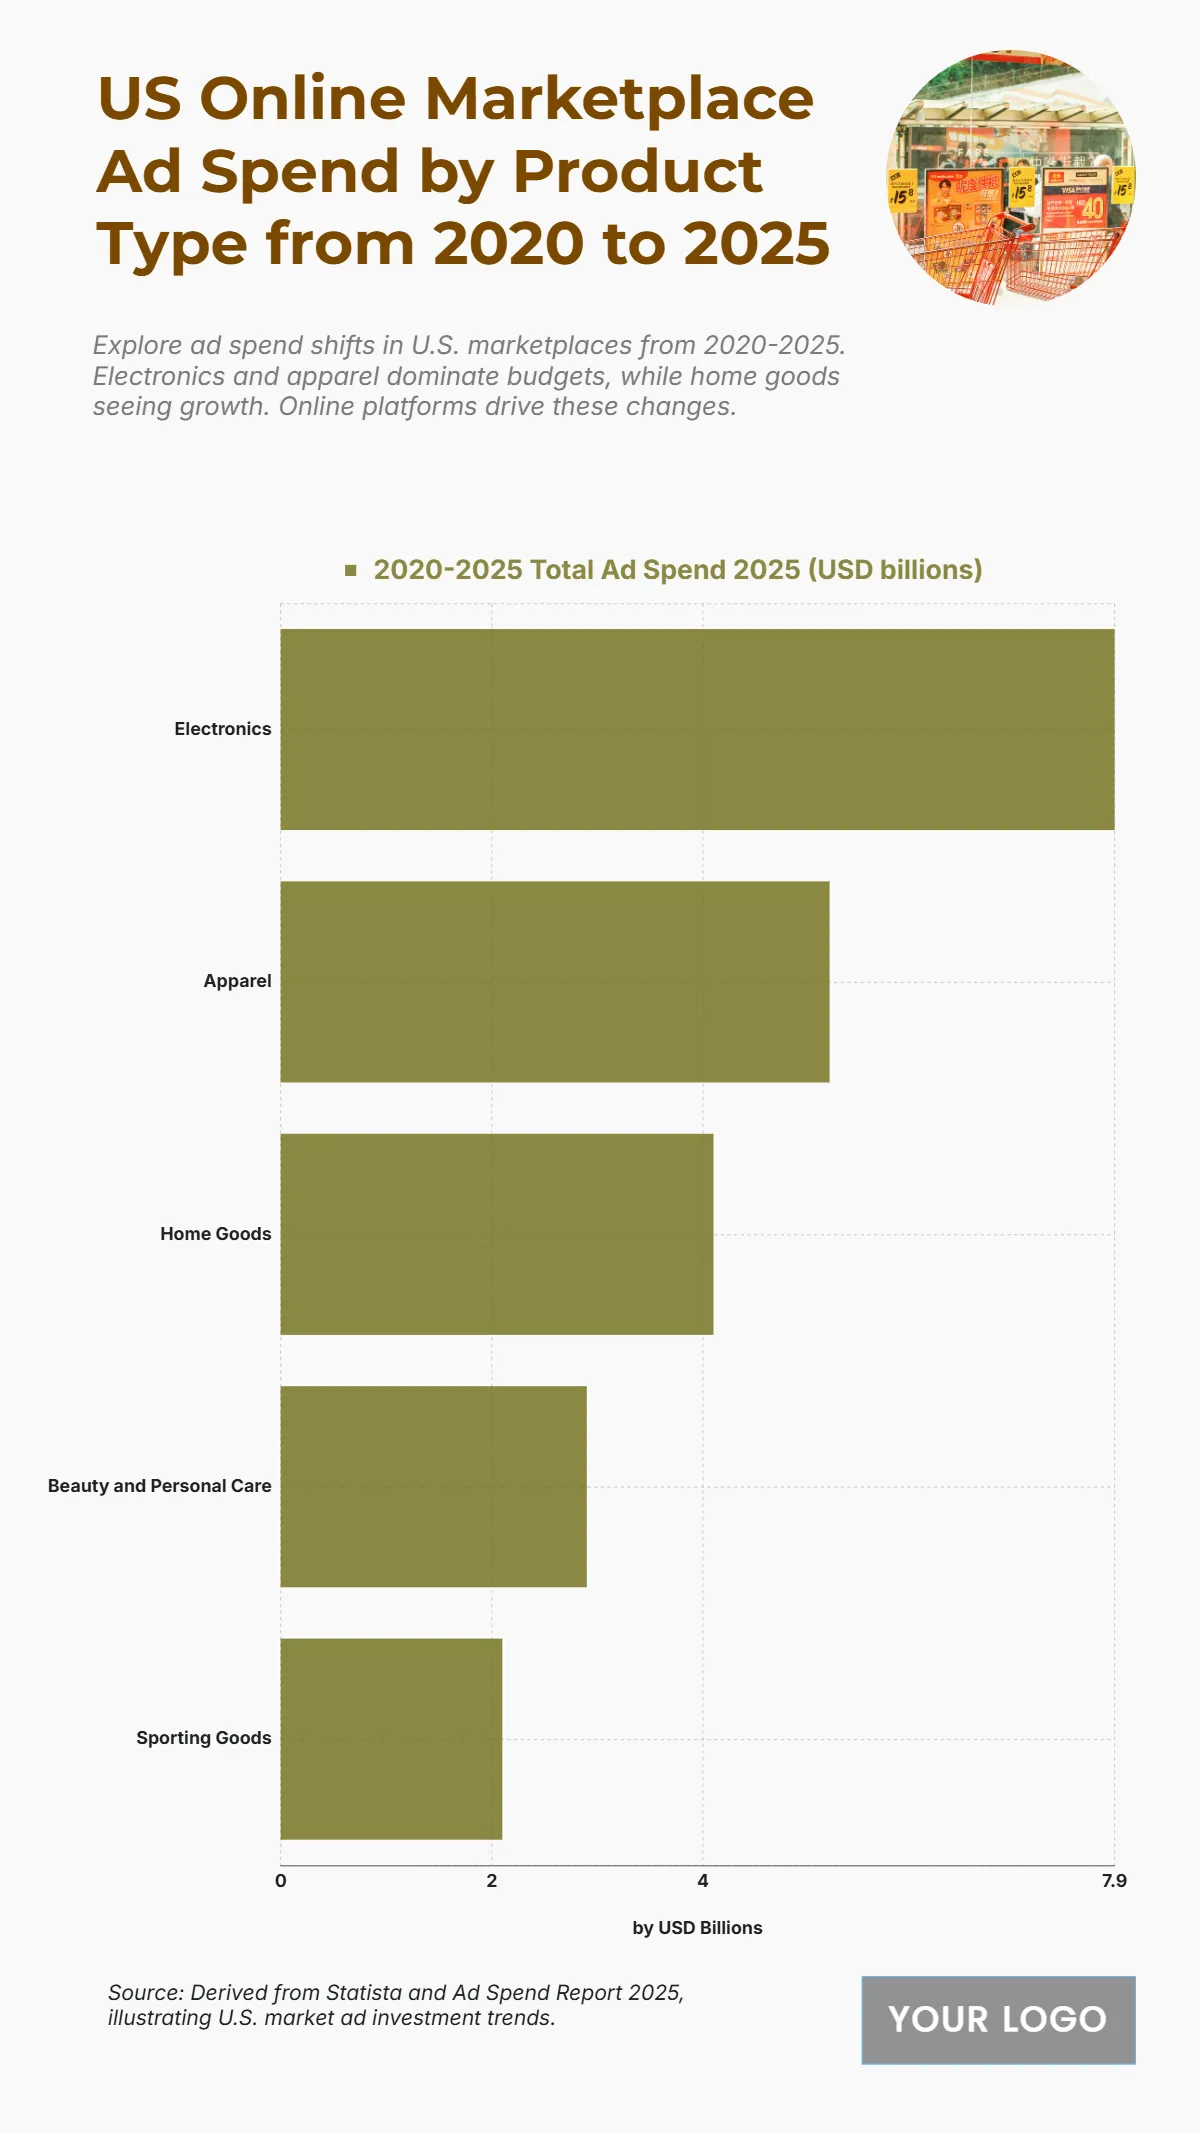
The chart displays the US Online Marketplace 2020–2025 Total Ad Spend (USD billions) by product type, illustrating the strategic allocation of ad budgets across different retail sectors. Electronics dominates the spending, with the highest total investment at 7.9 billion USD. Apparel is the second-largest category, with a significant total ad spend of 5.2 billion USD. Home Goods follows with 4.1 billion USD in ad spend. The remaining two categories have lower investment: Beauty and Personal Care at 2.9 billion USD and Sporting Goods with the lowest total ad spend at 2.1 billion USD. The data shows that ad spending is heavily concentrated in the Electronics and Apparel sectors, which together account for 13.1 billion USD of the total investment among the categories listed, highlighting their importance in the US online marketplace.
| Labels | 2020–2025 Total Ad Spend (USD billions) |
| Electronics | 7.9 |
| Apparel | 5.2 |
| Home Goods | 4.1 |
| Beauty and Personal Care | 2.9 |
| Sporting Goods | 2.1 |


