Free US Cross-Device Ad Conversion Rate Trends from 2015 to 2025 Chart
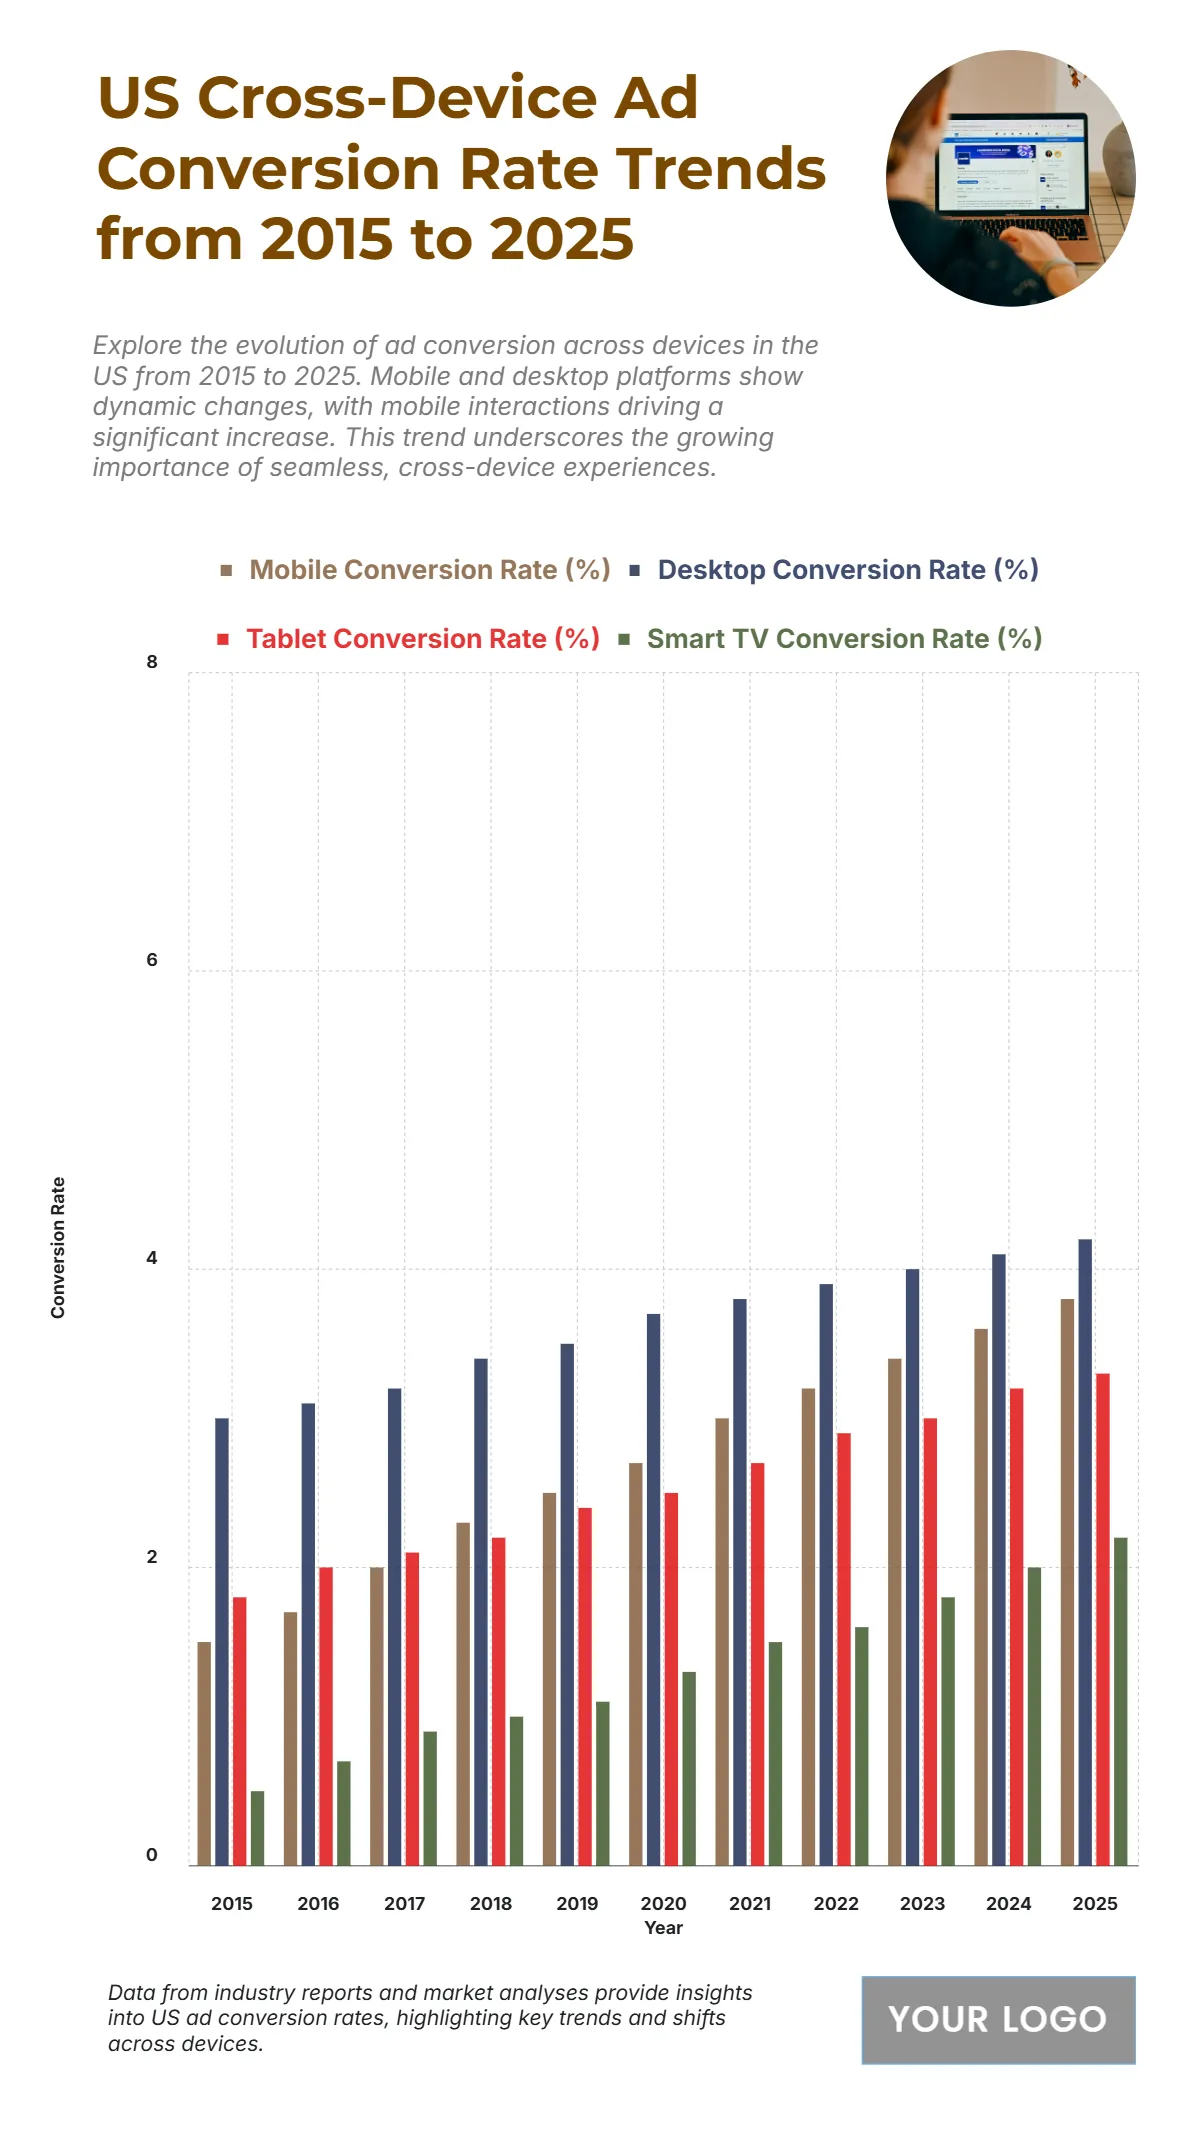
The chart displays the US Cross-Device Ad Conversion Rate (%) trends from 2015 to 2025 across four device categories: Mobile, Desktop, Tablet, and Smart TV. Desktop Conversion Rate (%) remains the highest throughout the decade, starting at 3% in 2015 and projected to reach 4.2% in 2025. Mobile Conversion Rate (%) shows the most significant proportional growth, nearly tripling from 1.5% in 2015 to 3.8% in 2025. Tablet Conversion Rate (%) follows a similar steady growth pattern, rising from 1.8% to 3.3% in 2025. The Smart TV Conversion Rate (%) is the lowest but shows the largest proportional increase, growing over four-fold from 0.5% in 2015 to 2.2% in 2025. Overall, while Desktop remains the top converter, the rapid growth in Mobile and Smart TV highlights a pronounced shift toward multi-device ad effectiveness.
| Labels | Mobile Conversion Rate (%) | Desktop Conversion Rate (%) | Tablet Conversion Rate (%) | Smart TV Conversion Rate (%) |
| 2015 | 1.5 | 3 | 1.8 | 0.5 |
| 2016 | 1.7 | 3.1 | 2 | 0.7 |
| 2017 | 2 | 3.2 | 2.1 | 0.9 |
| 2018 | 2.3 | 3.4 | 2.2 | 1 |
| 2019 | 2.5 | 3.5 | 2.4 | 1.1 |
| 2020 | 2.7 | 3.7 | 2.5 | 1.3 |
| 2021 | 3 | 3.8 | 2.7 | 1.5 |
| 2022 | 3.2 | 3.9 | 2.9 | 1.6 |
| 2023 | 3.4 | 4 | 3 | 1.8 |
| 2024 | 3.6 | 4.1 | 3.2 | 2 |
| 2025 | 3.8 | 4.2 | 3.3 | 2.2 |


