Free US Retail Ad Click-Through Rate Trends from 2015 to 2025 Chart
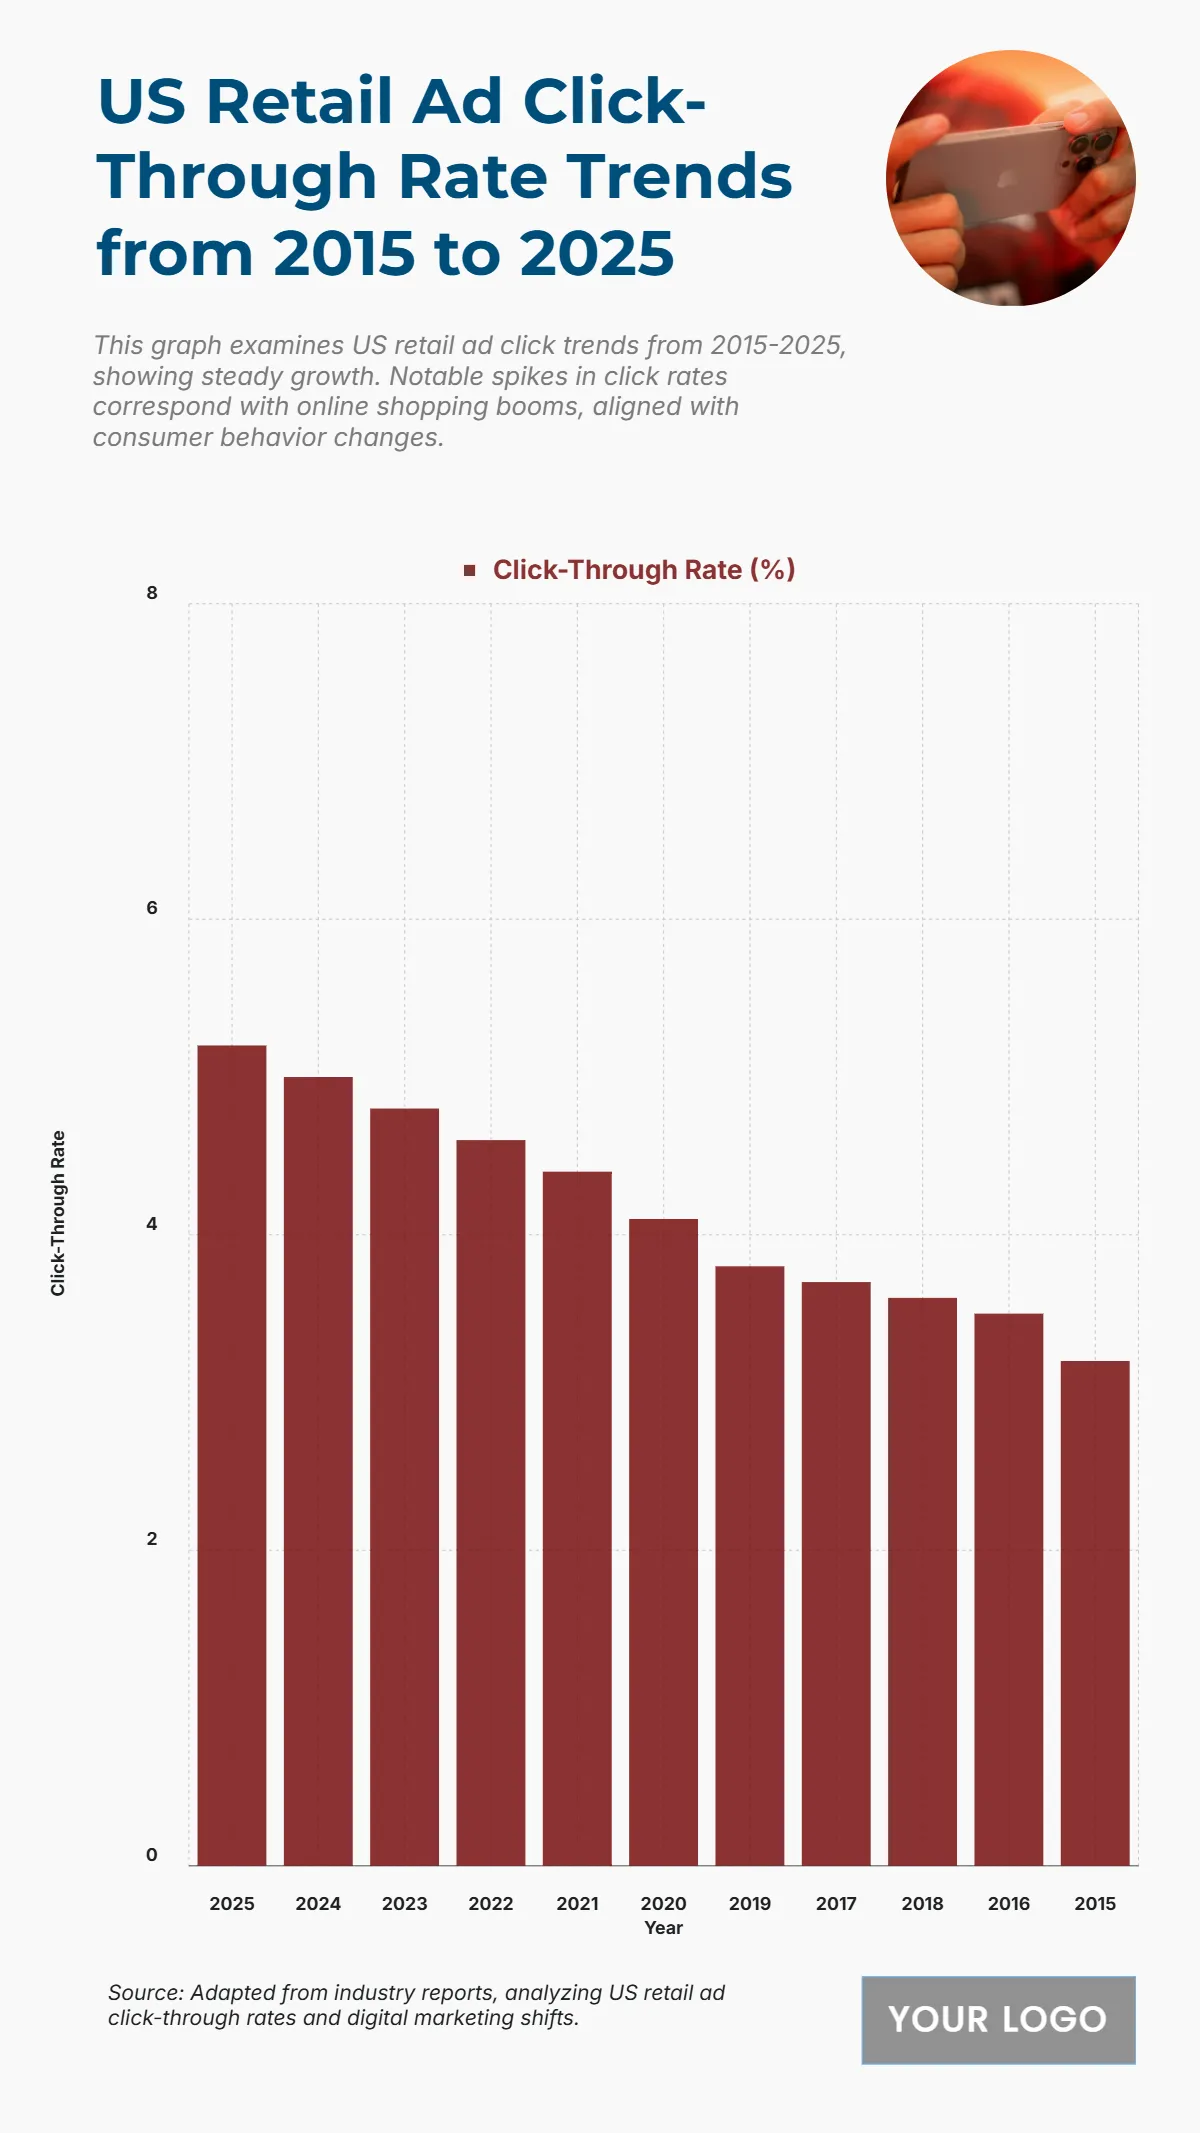
The chart displays the US Retail Ad Click-Through Rate (%) from 2015 to 2025, indicating a consistent and continuous upward trend in performance over the decade. The Click-Through Rate (%) started at its lowest point in 2015 with 3.2%. It increased steadily to 3.5% in 2016, 3.7% in 2017, 3.6% in 2018, and 3.8% in 2019. The growth accelerated, crossing the 4% mark in 2020 with 4.1%, followed by 4.4% in 2021 and 4.6% in 2022. The rate is projected to be 4.8% in 2023, 5% in 2024, and peak at 5.2% in 2025. The total increase in the Click-Through Rate is 2 percentage points ($\mathbf{5.2\% - 3.2\% = 2\%}$) over the ten-year period, demonstrating significant improvement in the effectiveness of US retail advertising in driving consumer clicks.
| Labels | Click-Through Rate (%) |
| 2025 | 5.2 |
| 2024 | 5 |
| 2023 | 4.8 |
| 2022 | 4.6 |
| 2021 | 4.4 |
| 2020 | 4.1 |
| 2019 | 3.8 |
| 2017 | 3.7 |
| 2018 | 3.6 |
| 2016 | 3.5 |
| 2015 | 3.2 |


