Free US Ad Revenue Growth by Industry from 2015 to 2025 Chart
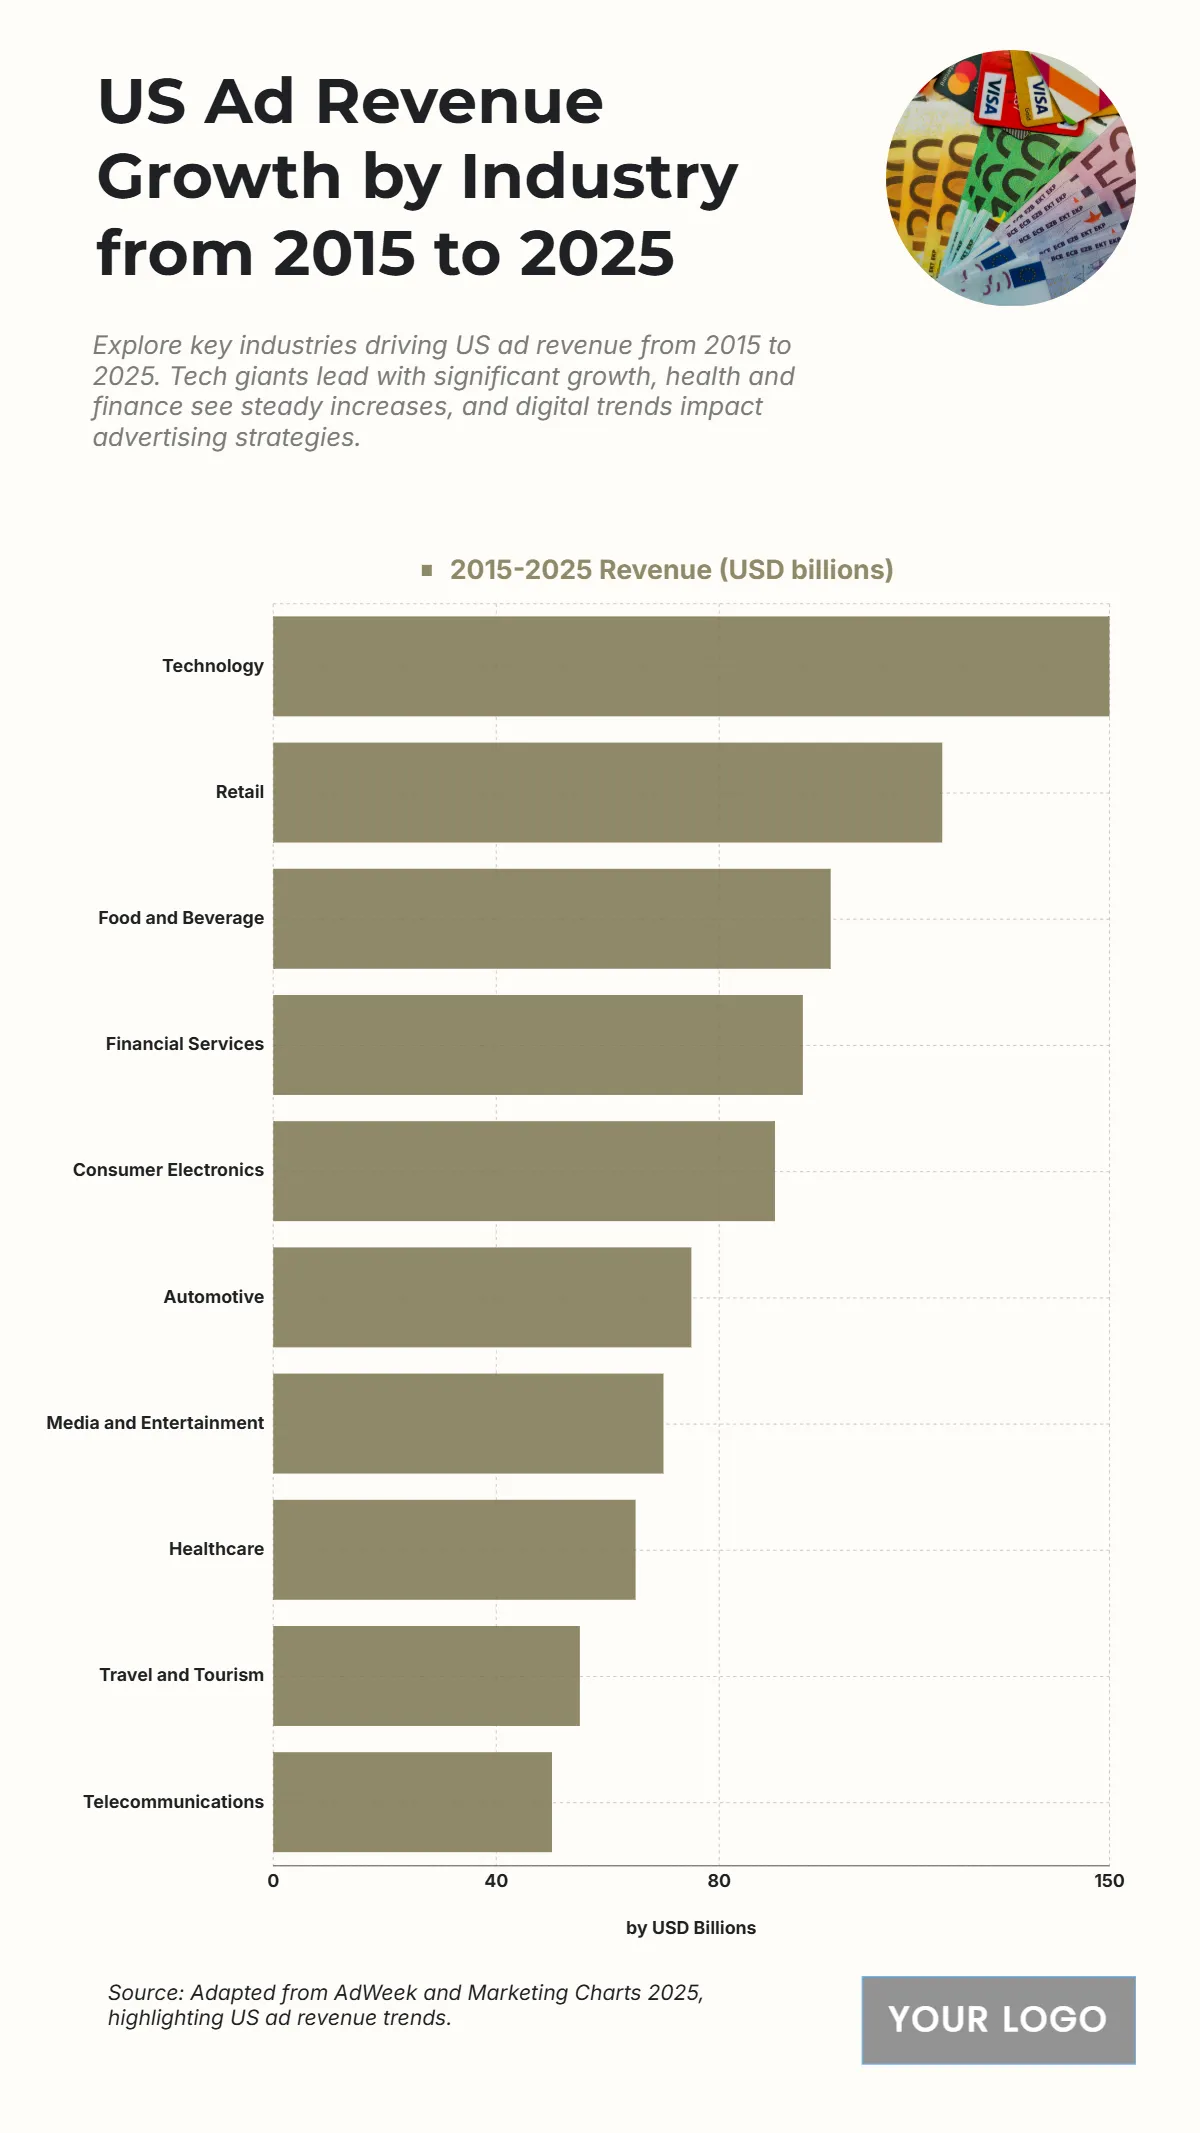
The chart displays the US Ad Revenue Growth by Industry for the 2015–2025 Revenue (USD billions), illustrating the total revenue generated by ten major industries. Technology leads all sectors with the highest revenue at 150 billion USD. Retail is the second largest sector with 120 billion USD. Food and Beverage is the third-highest with 100 billion USD. Following these are Financial Services at 95 billion USD and Consumer Electronics at 90 billion USD. The lowest revenue is generated by Telecommunications at 50 billion USD, and Travel and Tourism at 55 billion USD. The data confirms the dominance of Technology and Retail in driving US ad revenue growth, with their combined total of 270 billion USD representing a significant portion of the overall market.
| Labels | 2015–2025 Revenue (USD billions) |
| Technology | 150 |
| Retail | 120 |
| Food and Beverage | 100 |
| Financial Services | 95 |
| Consumer Electronics | 90 |
| Automotive | 75 |
| Media and Entertainment | 70 |
| Healthcare | 65 |
| Travel and Tourism | 55 |
| Telecommunications | 50 |


