Free US Social Commerce Ad Spend Trends from 2020 to 2025 Chart
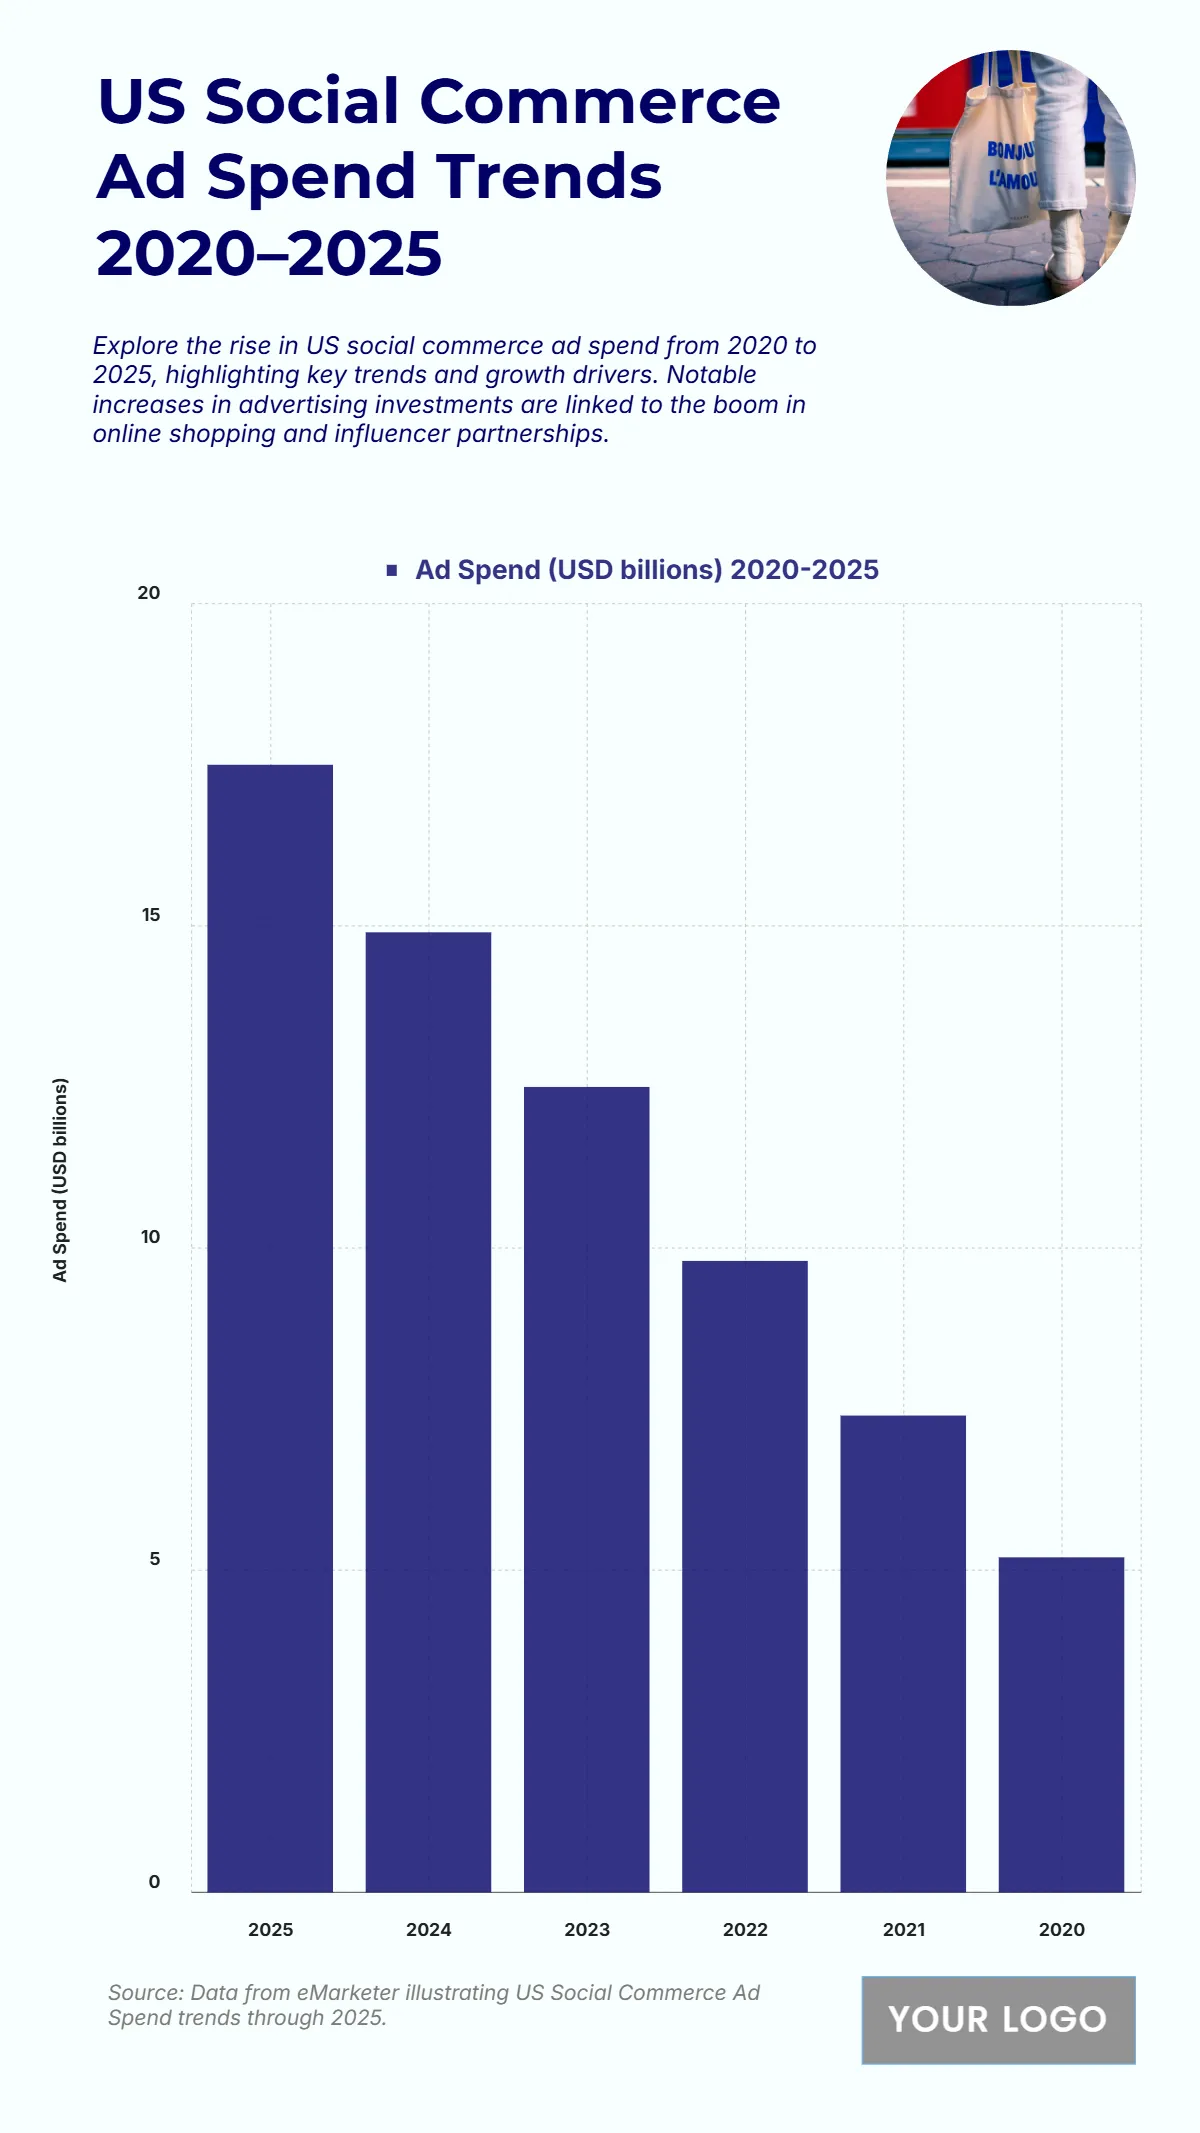
The chart reveals a remarkable surge in U.S. social commerce ad spend from 2020 to 2025, demonstrating the rapid growth of online shopping and influencer-driven marketing strategies. In 2020, ad spend was USD 5.2 billion, marking the starting point of this upward trend. By 2021, it rose to USD 7.4 billion, showing early momentum as e-commerce accelerated. Spending continued its steep climb to USD 9.8 billion in 2022, followed by USD 12.5 billion in 2023. The growth trajectory strengthened further in 2024, reaching USD 14.9 billion, and peaked at USD 17.5 billion in 2025, more than tripling the 2020 figure. This increase reflects a strategic shift toward digital-first retail, where brands invest heavily in targeted social advertising to capitalize on consumer engagement and platform shopping integrations. Overall, the data indicates a sustained, aggressive growth curve, highlighting social commerce as a dominant force in digital marketing landscapes.
| Year | Ad Spend (USD billions) |
|---|---|
| 2020 | 5.2 |
| 2021 | 7.4 |
| 2022 | 9.8 |
| 2023 | 12.5 |
| 2024 | 14.9 |
| 2025 | 17.5 |


