Free US Social Media Ad Frequency vs Engagement Rate from 2018 to 2025 Chart
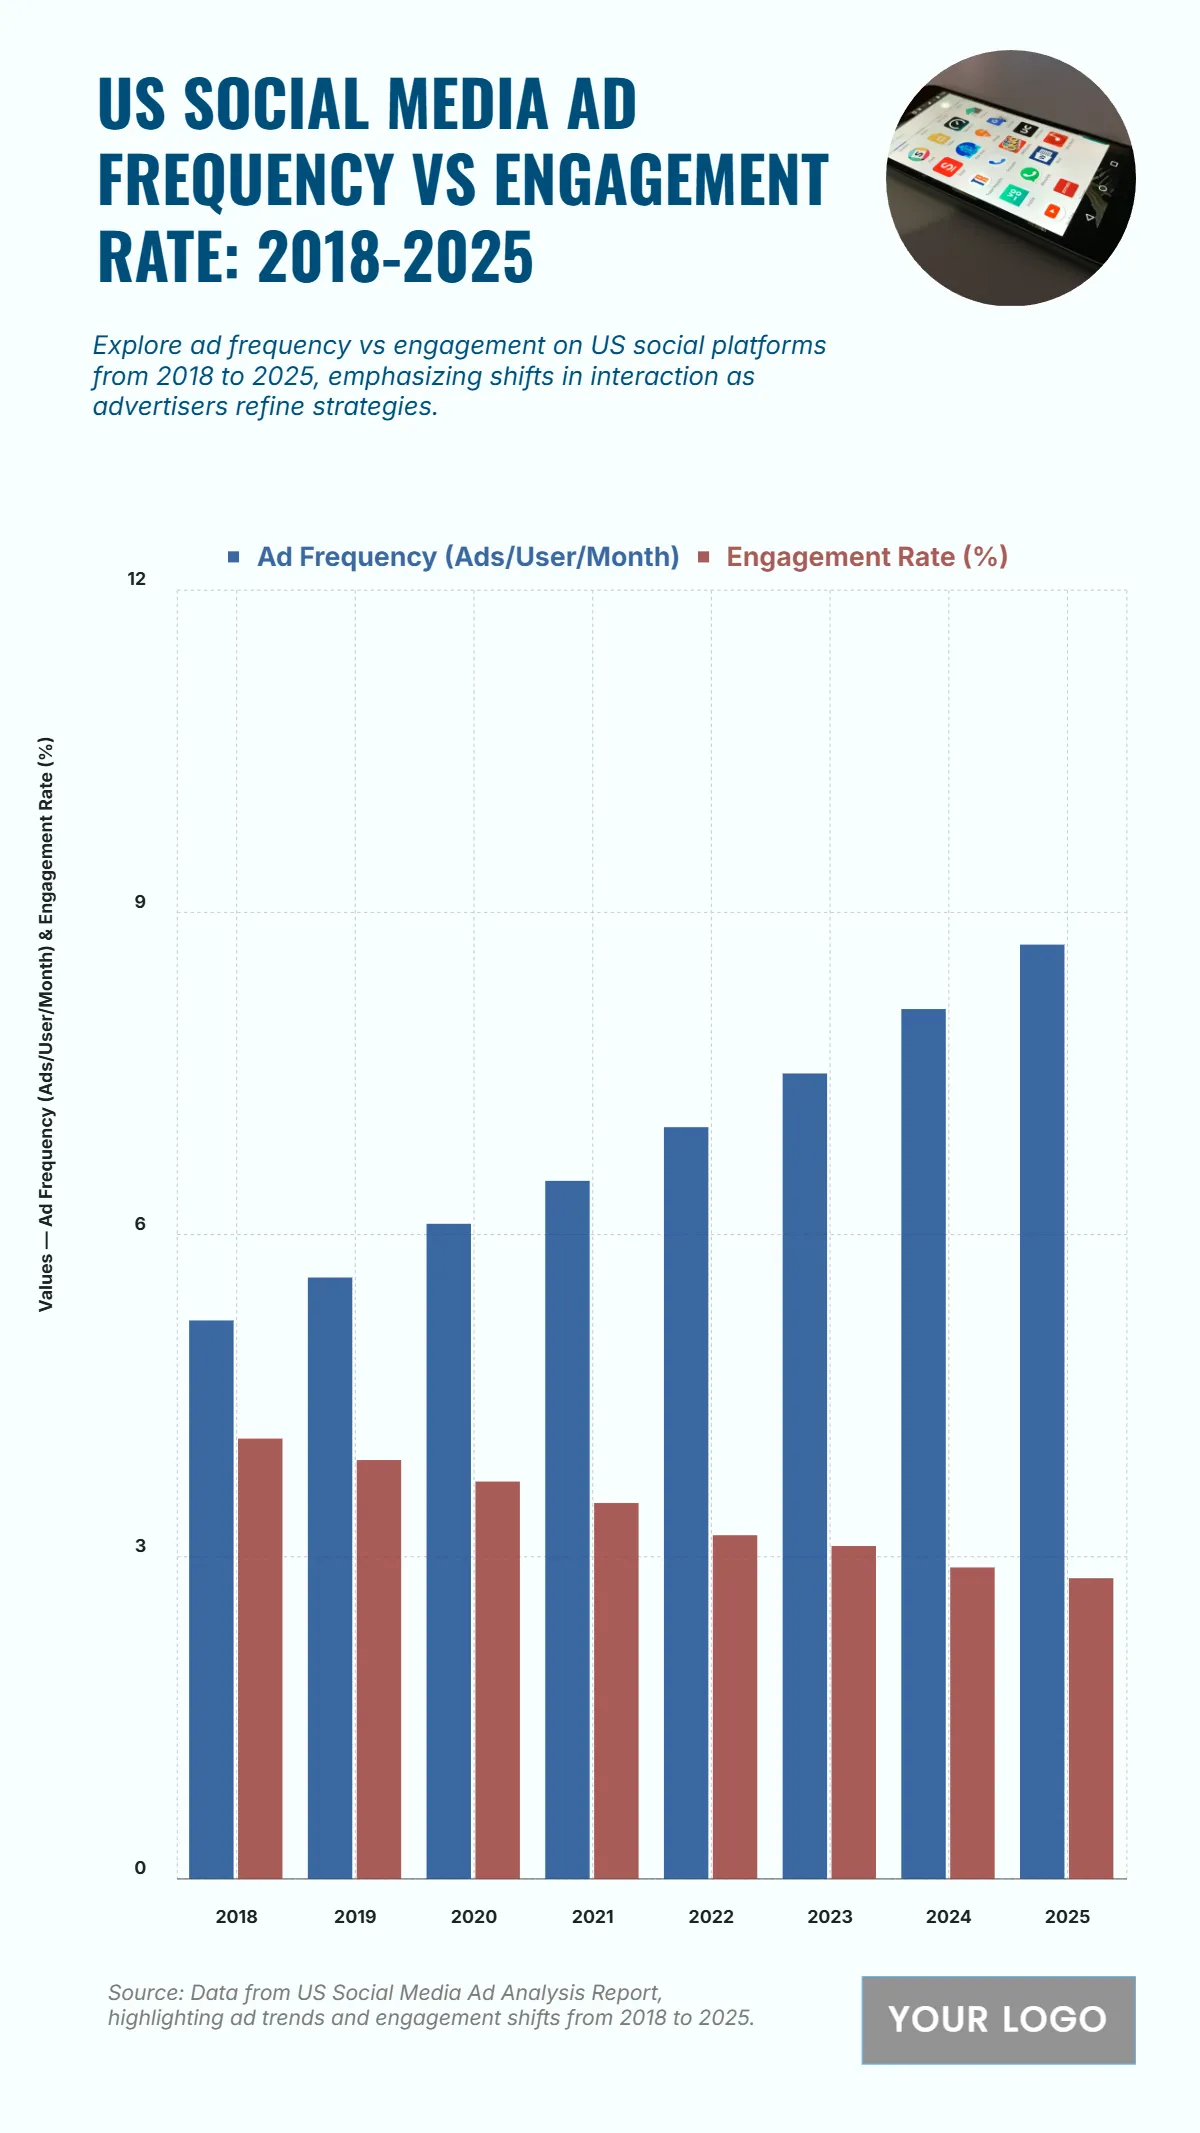
The chart highlights a clear inverse relationship between ad frequency and engagement rates on social media. Ad frequency climbs from 5.2 ads per user per month in 2018 to 8.7 by 2025, indicating more aggressive ad placement strategies. However, during the same period, the engagement rate declines from 4.1% to 2.8%, reflecting user fatigue and increased competition for attention. The data suggests that while platforms are maximizing ad exposure, advertiser efficiency per impression is dropping, underscoring the importance of more targeted, creative, and contextually relevant advertising strategies to maintain engagement in an increasingly saturated digital space.
| Year | Ad Frequency (Ads/User/Month) | Engagement Rate (%) |
|---|---|---|
| 2018 | 5.2 | 4.1 |
| 2019 | 5.6 | 3.9 |
| 2020 | 6.1 | 3.7 |
| 2021 | 6.5 | 3.5 |
| 2022 | 7.0 | 3.2 |
| 2023 | 7.5 | 3.1 |
| 2024 | 8.1 | 2.9 |
| 2025 | 8.7 | 2.8 |


