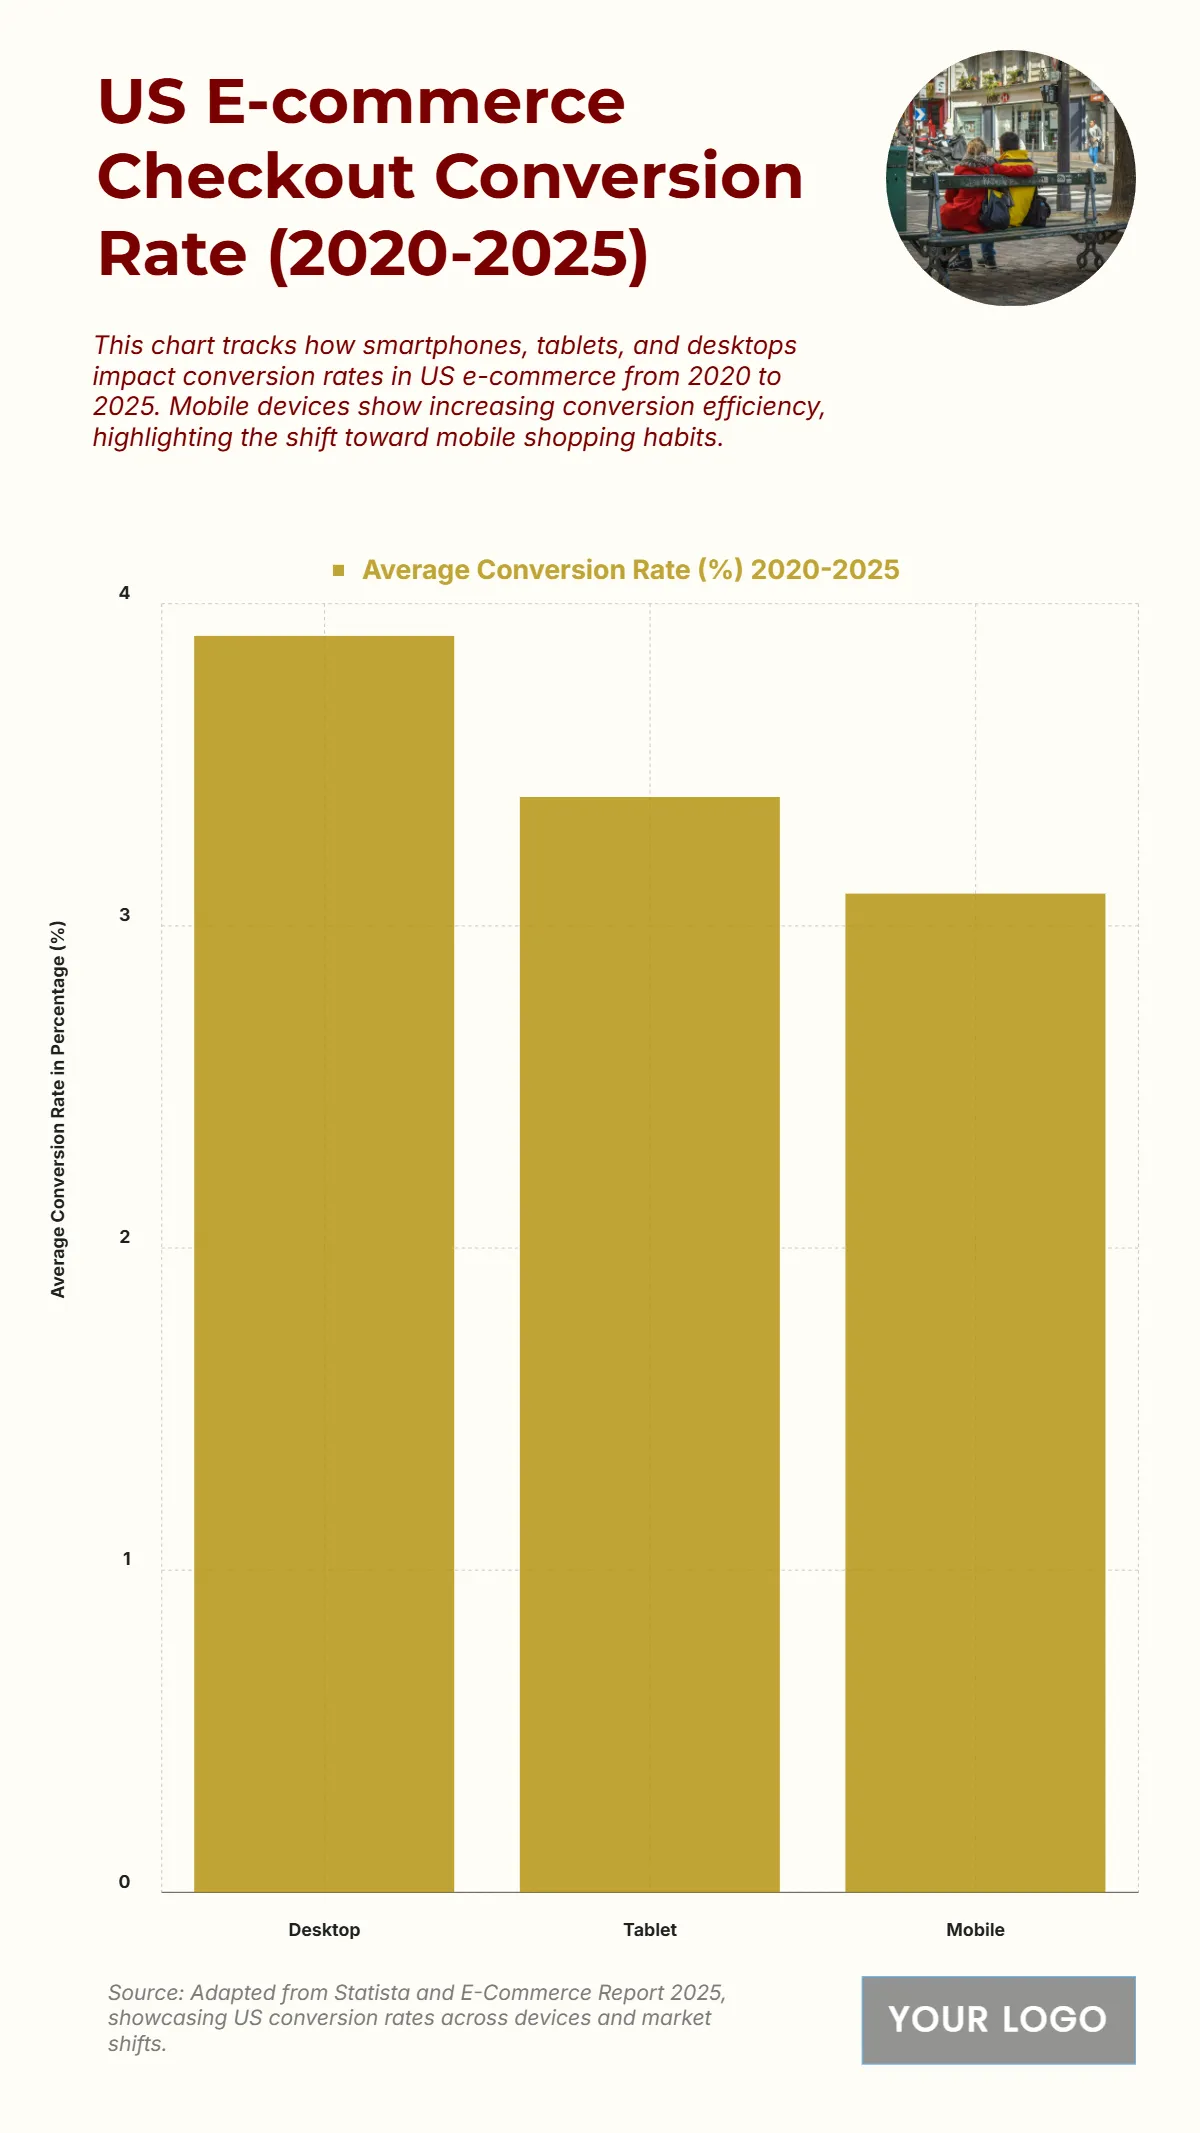
Free US E-commerce Checkout Conversion Rate by Device from 2020 to 2025 Chart
The chart reveals desktop devices leading in checkout conversions with 3.9%, indicating stronger purchase intent and smoother transaction experiences on larger screens. Tablets follow at 3.4%, reflecting moderate performance, while mobile devices lag slightly at 3.1%, despite their growing usage. This gap underscores challenges such as smaller screen usability, slower checkout experiences, and potential trust barriers in mobile commerce. However, the overall rates suggest steady adoption of e-commerce across all device types, with mobile holding significant potential as mobile-optimized shopping experiences improve.
| Device | Average Conversion Rate (%) |
|---|---|
| Desktop | 3.9 |
| Tablet | 3.4 |
| Mobile | 3.1 |


