Free US Ad Spend Efficiency by Region from 2015 to 2025 Chart
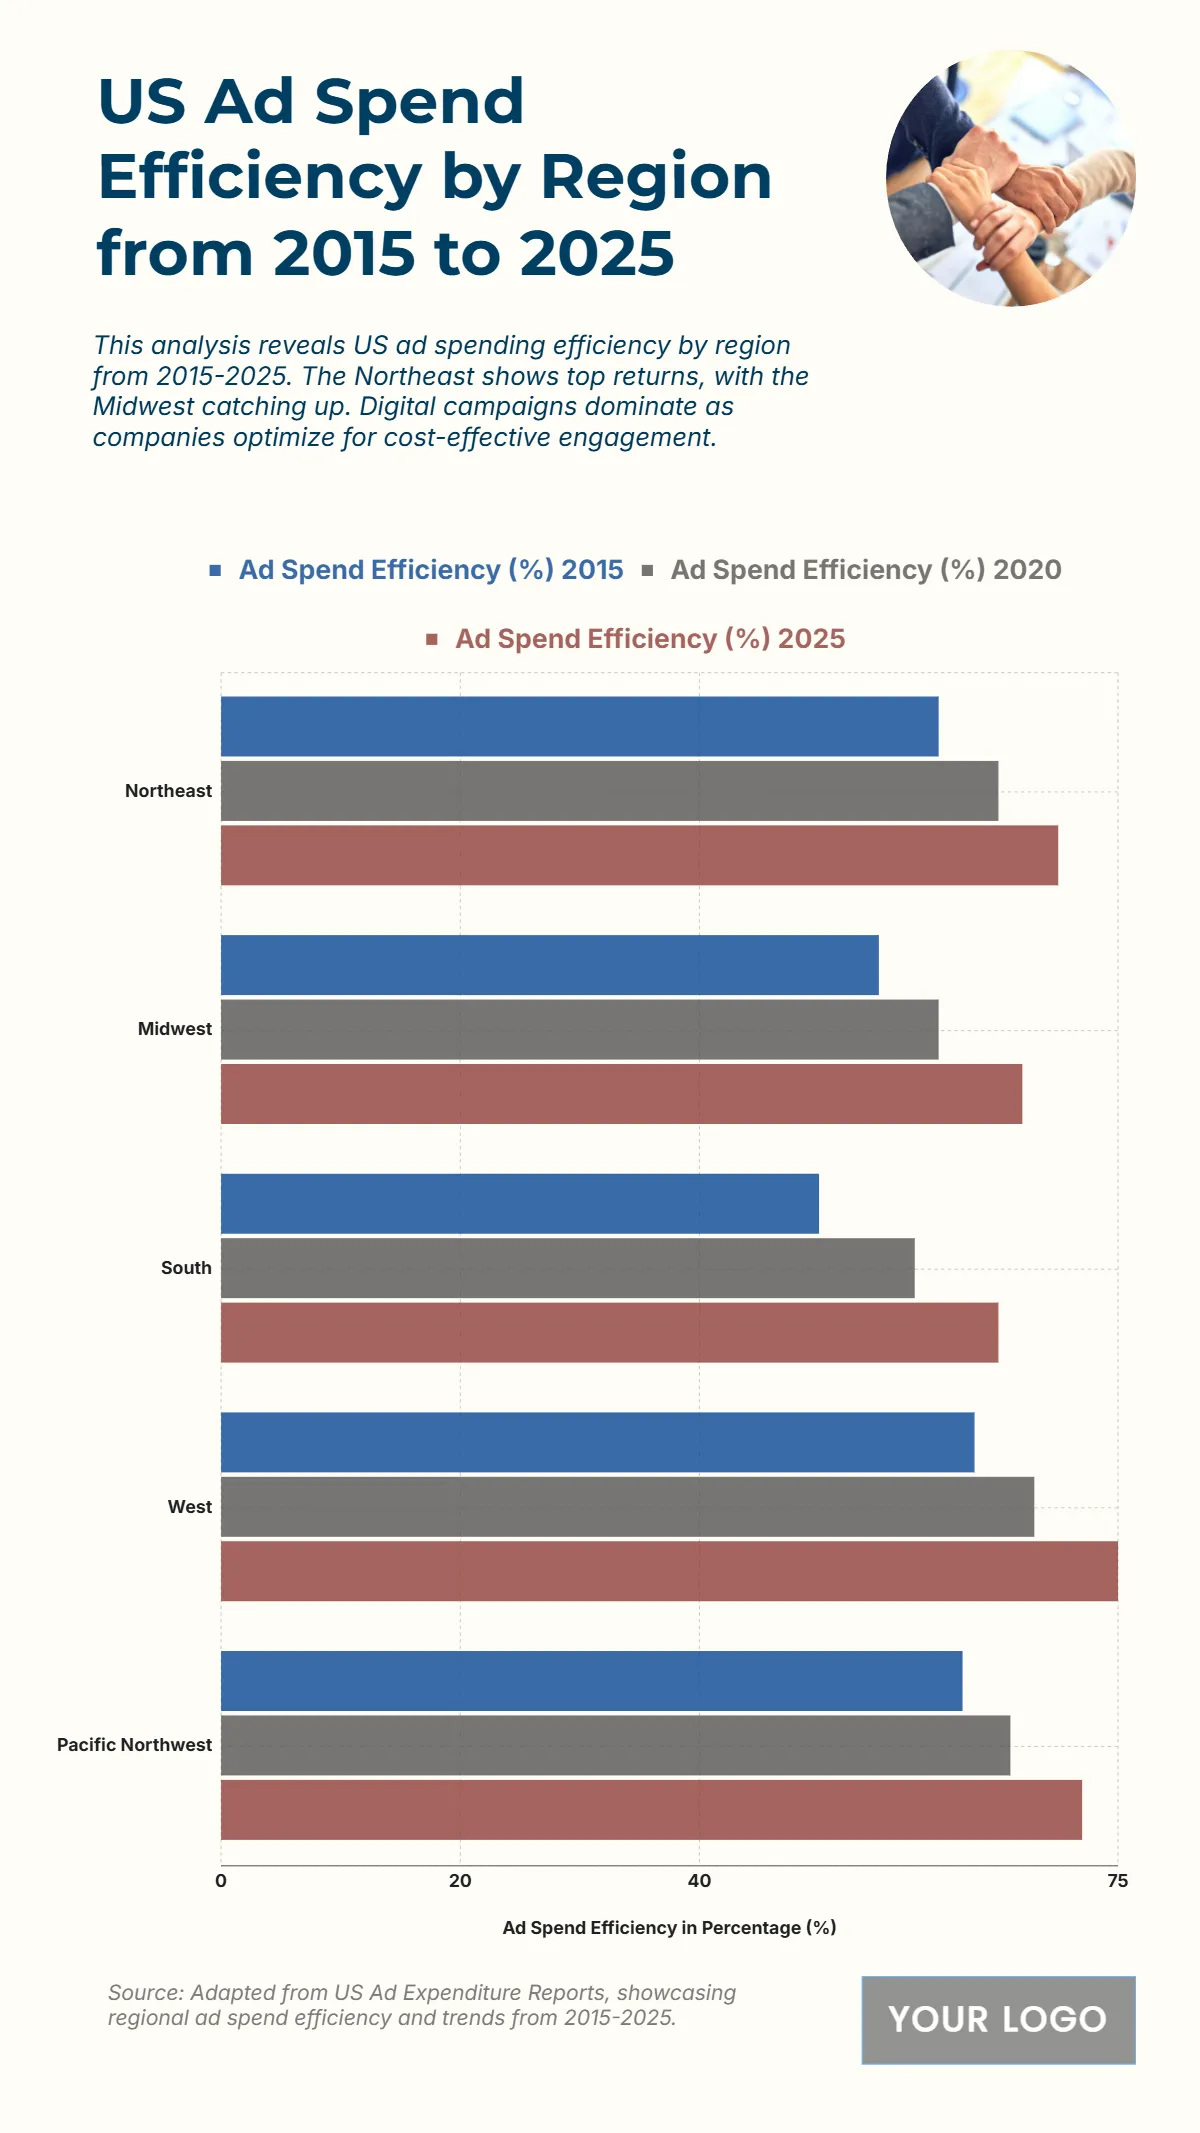
The chart highlights a significant improvement in ad spend efficiency across all U.S. regions over the ten-year period. The Northeast saw an increase from 60% in 2015 to 65% in 2020, reaching 70% by 2025, reflecting consistent performance. The Midwest improved from 55% to 67%, showing one of the strongest growth rates, indicating better digital optimization. The South experienced a notable leap from 50% in 2015 to 65% in 2025, narrowing the gap with other regions. The West achieved the highest efficiency, jumping from 63% in 2015 to 75% in 2025, underscoring its dominance in cost-effective digital ad strategies. Meanwhile, the Pacific Northwest rose from 62% to 72%, reflecting solid performance gains. These upward trends point to advances in digital targeting, programmatic buying, and regional ad strategy refinement over the decade.
| Region | 2015 (%) | 2020 (%) | 2025 (%) |
|---|---|---|---|
| Northeast | 60 | 65 | 70 |
| Midwest | 55 | 60 | 67 |
| South | 50 | 58 | 65 |
| West | 63 | 68 | 75 |
| Pacific Northwest | 62 | 66 | 72 |


