Free US Mobile Ad Market Share by Category from 2018 to 2025 Chart
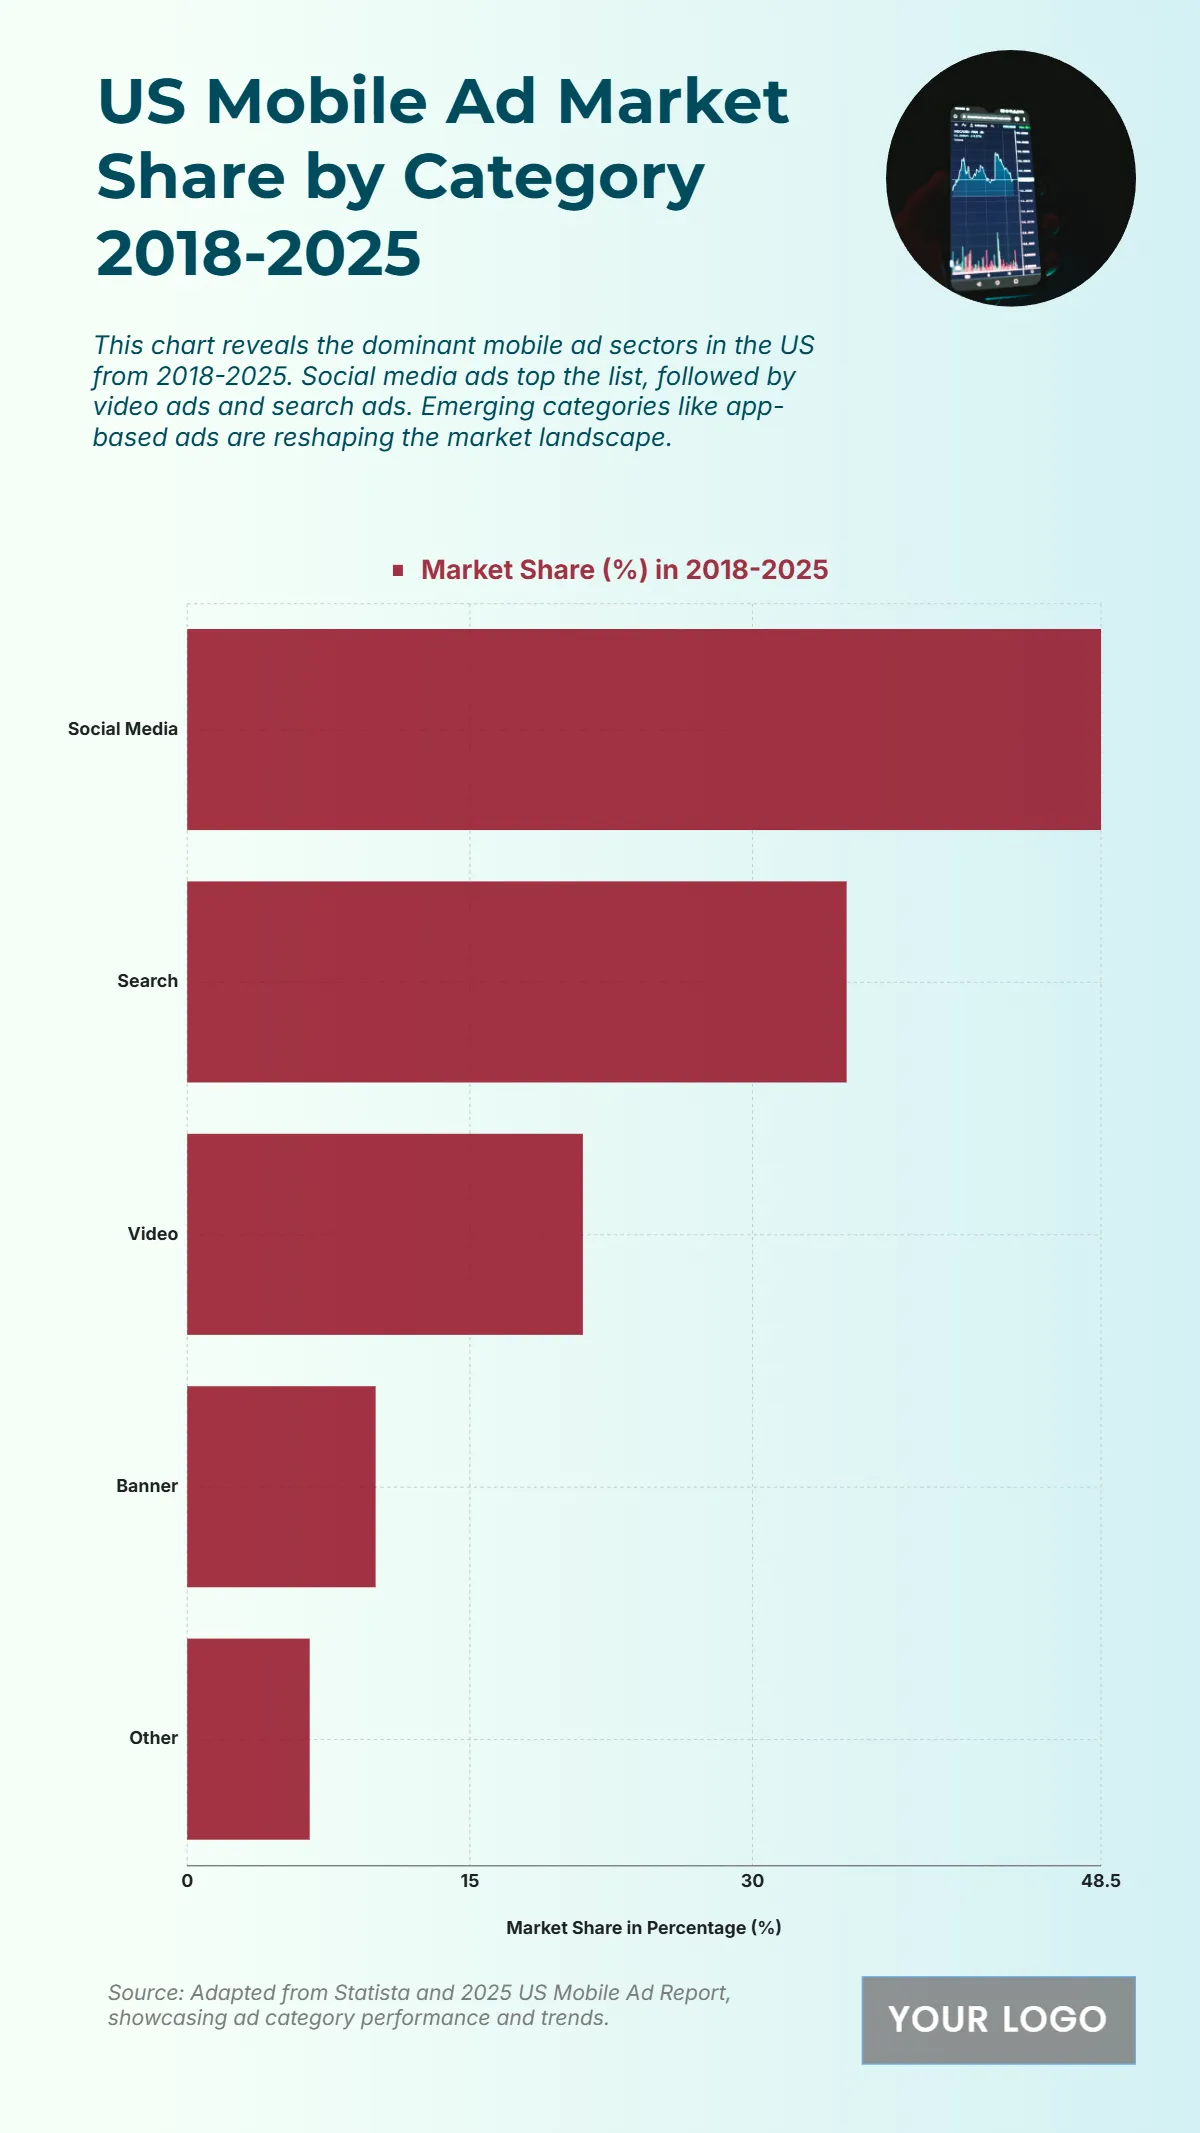
The chart shows social media as the dominant category in the U.S. mobile ad market, capturing 48.5% of total share, reflecting advertisers’ focus on high-engagement, targeted campaigns. Search advertising follows at 35%, underlining its continued effectiveness in driving conversions and user intent targeting. Video advertising holds a 21% share, indicating the growing impact of immersive, visual storytelling in mobile environments. Meanwhile, banner ads (10%) and other formats (6.5%) maintain smaller shares, likely serving as supplementary channels rather than primary drivers. This distribution emphasizes the dominance of interactive and performance-driven ad formats as marketers prioritize ROI and engagement.
| Category | Market Share (%) |
|---|---|
| Social Media | 48.5 |
| Search | 35 |
| Video | 21 |
| Banner | 10 |
| Other | 6.5 |


