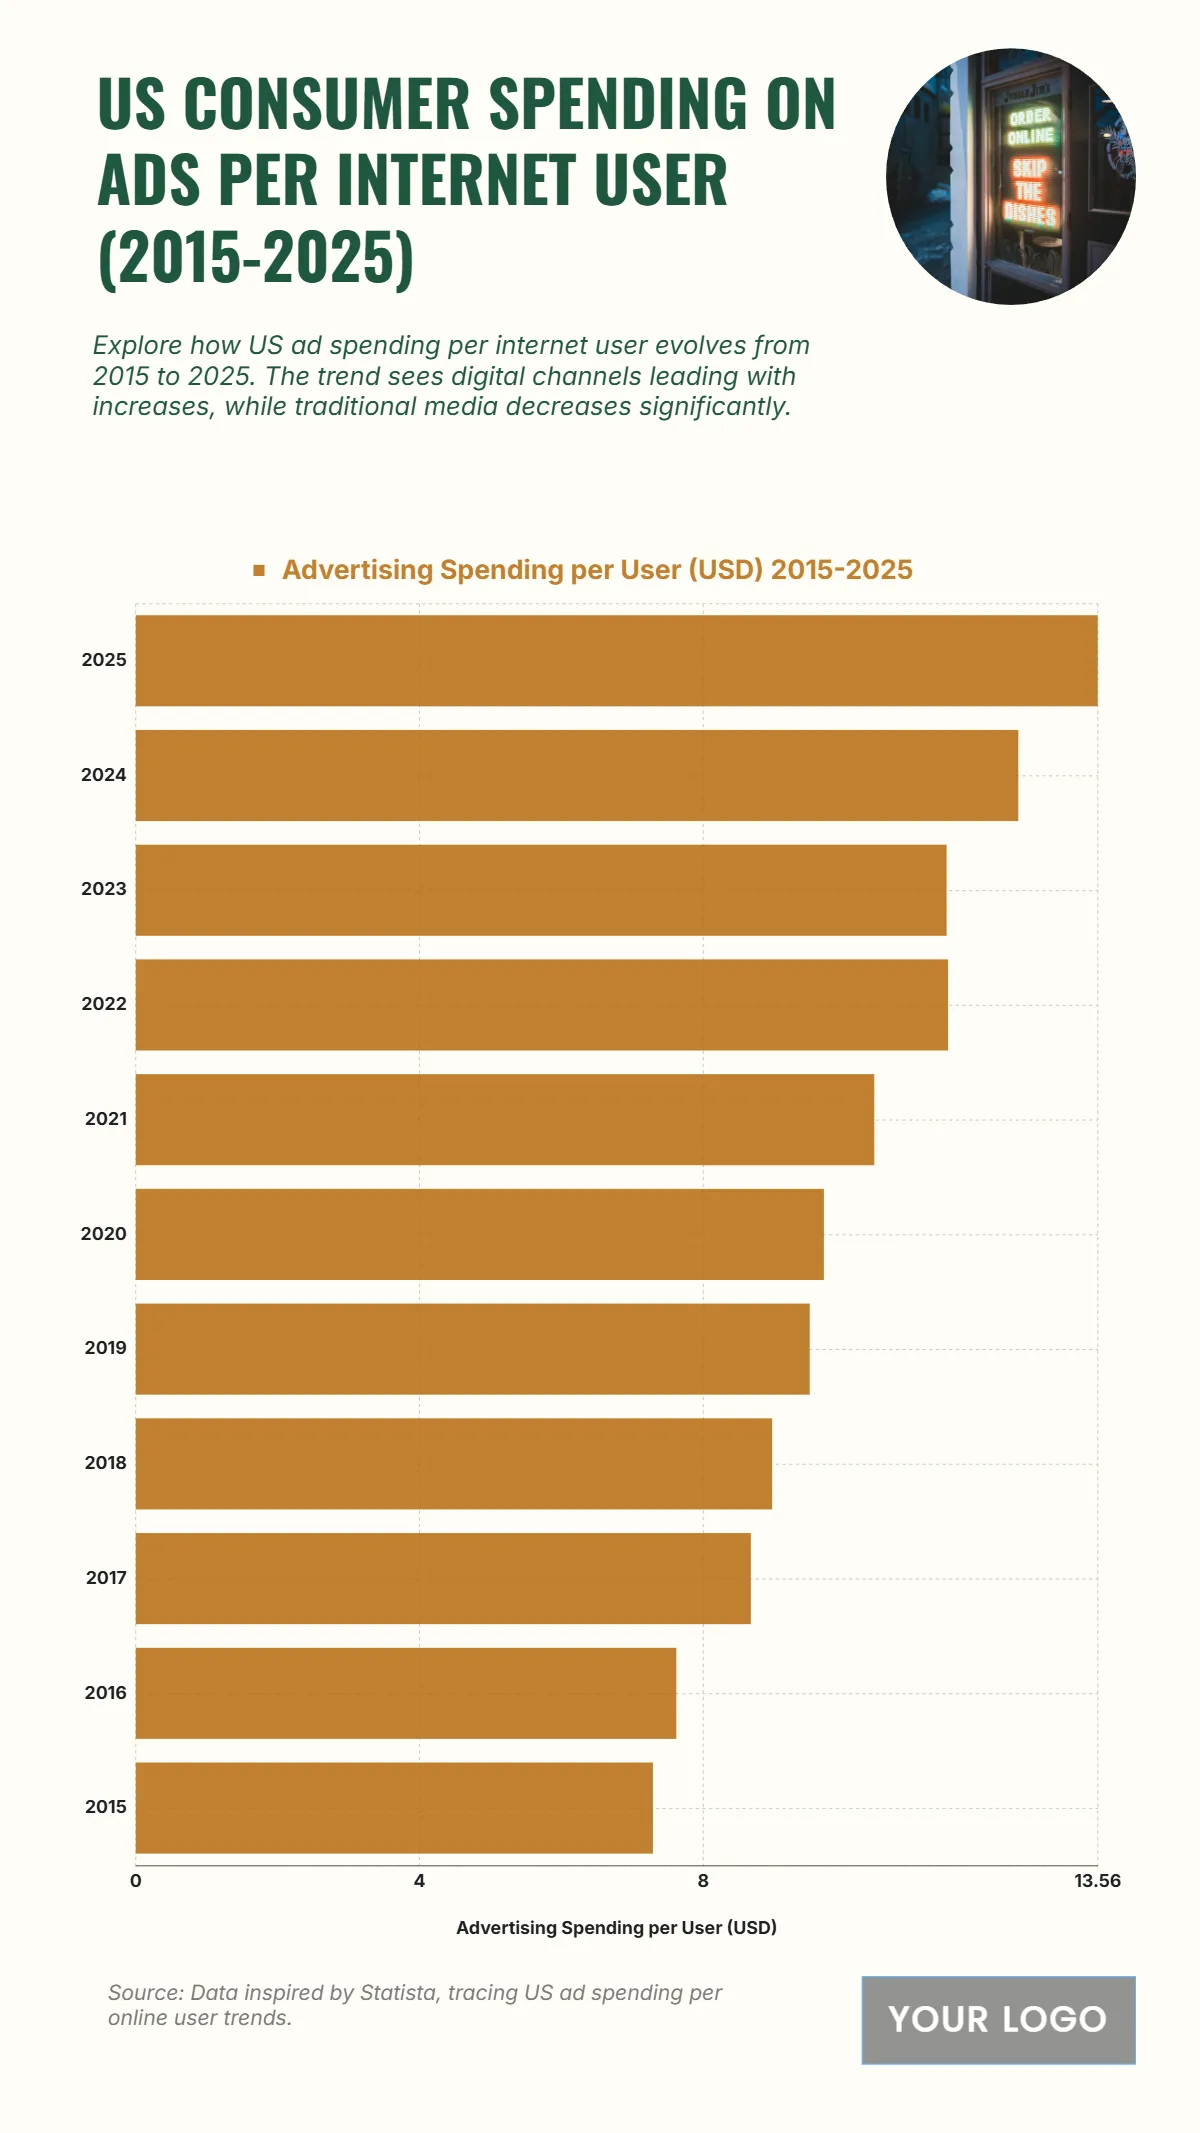
Free US Consumer Spending on Ads per Internet User from 2015 to 2025 Chart
The chart reflects a steady increase in ad spending per internet user from 2015 to 2025, illustrating the rising monetization of digital audiences. Spending rose from USD 7.29 in 2015 to USD 9.7 in 2020, marking early digital ad maturity. From 2021 onward, growth accelerated sharply, climbing to USD 13.56 by 2025, a nearly 86% increase over the decade. This trend indicates that advertisers are investing more per individual user, signaling a shift toward precision targeting, personalized campaigns, and higher customer lifetime value strategies. The sustained growth underscores the escalating value of digital engagement as a core revenue driver in the advertising ecosystem.
| Year | Ad Spending per User (USD) |
|---|---|
| 2015 | 7.29 |
| 2016 | 7.62 |
| 2017 | 8.67 |
| 2018 | 8.97 |
| 2019 | 9.5 |
| 2020 | 9.7 |
| 2021 | 10.41 |
| 2022 | 11.45 |
| 2023 | 11.43 |
| 2024 | 12.44 |
| 2025 | 13.56 |


