Free US Social Media Platform Ad Revenue Comparison from 2015 to 2025 Chart
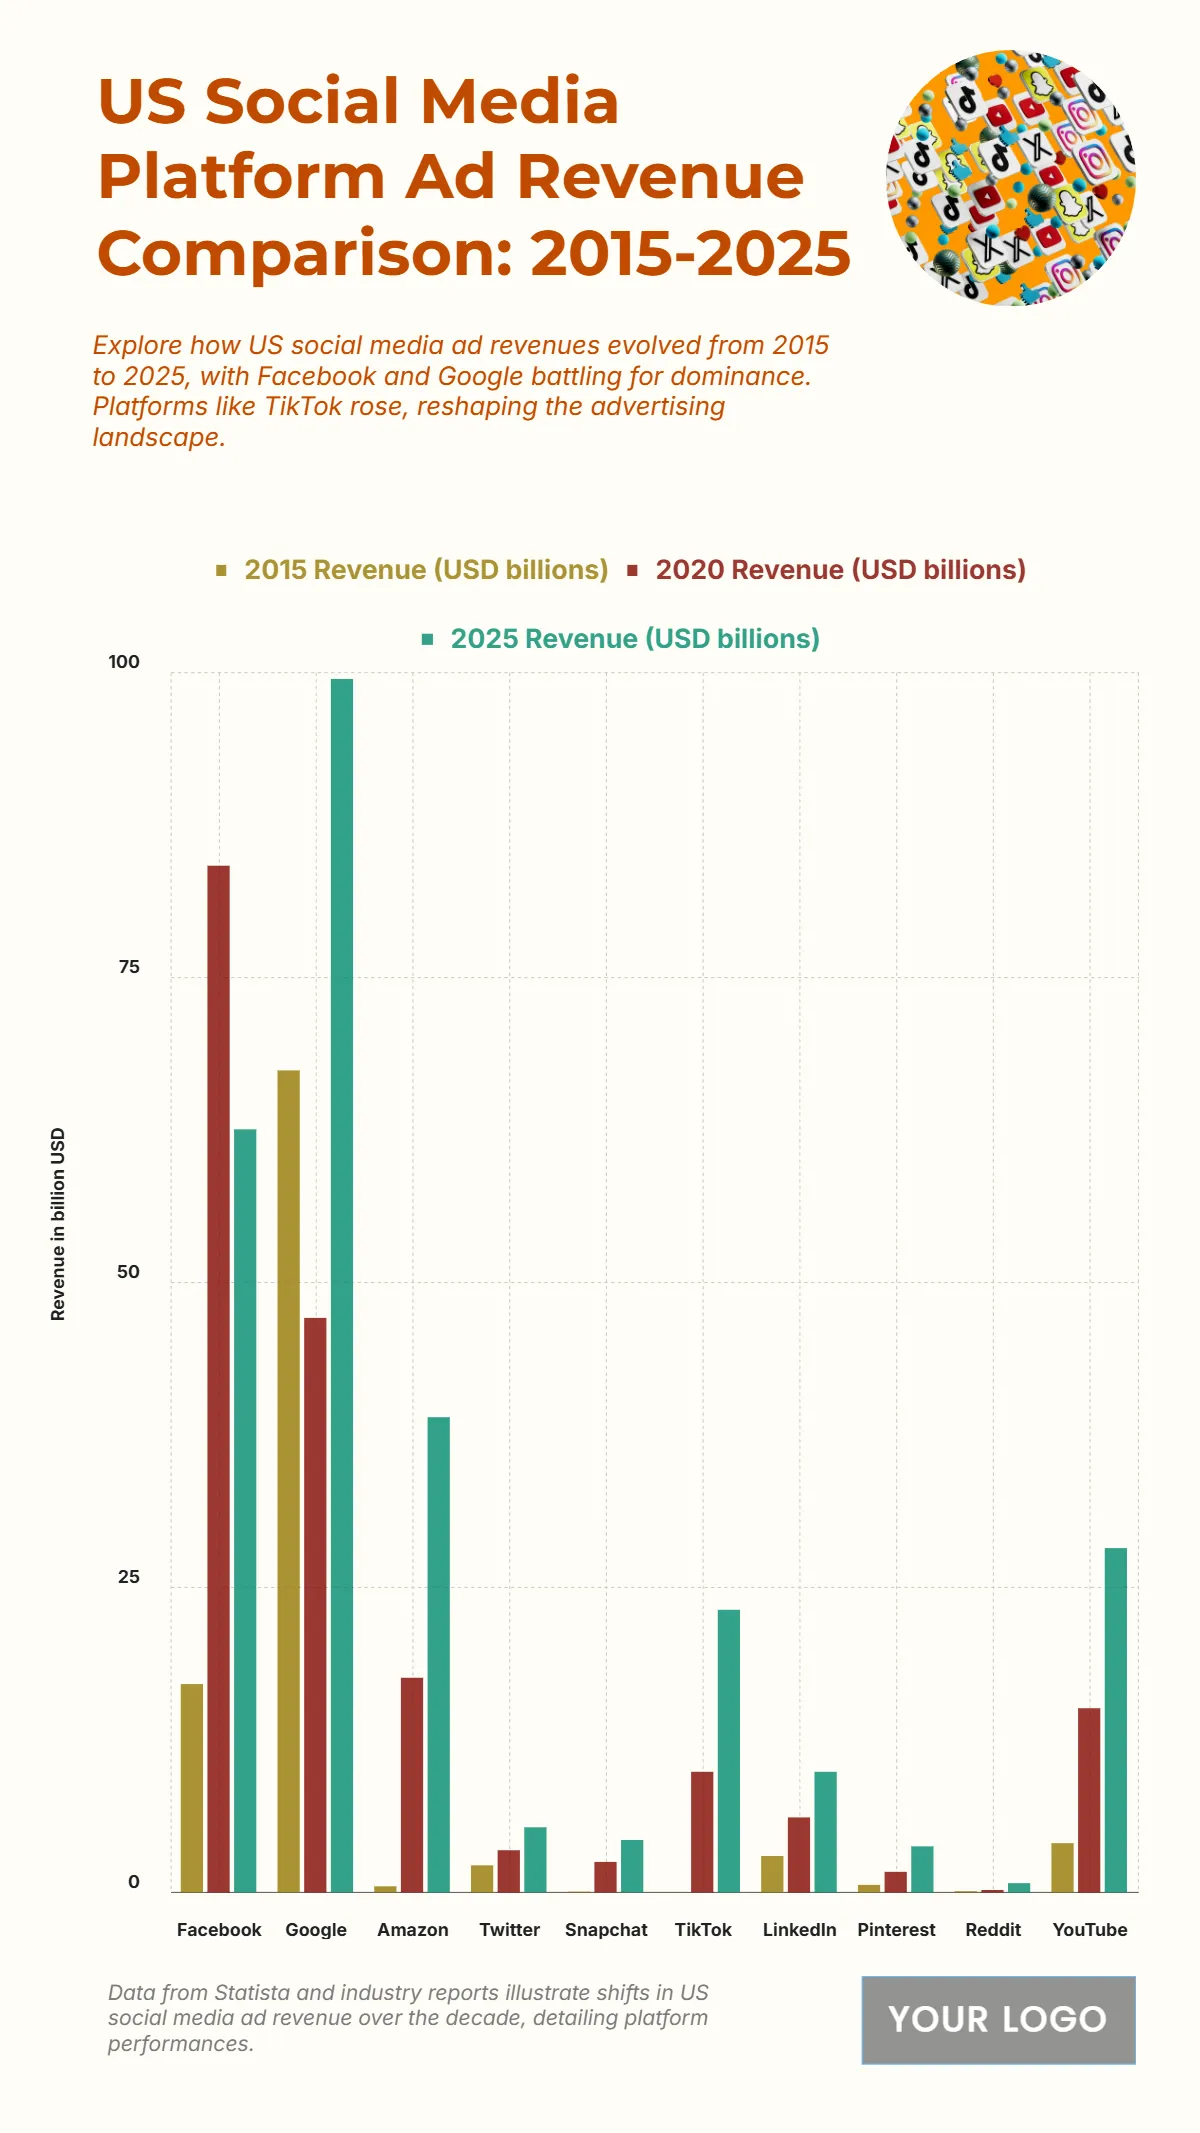
The chart highlights remarkable growth in platform ad revenues over the decade, with Google emerging as the top platform at USD 99.48 billion in 2025, surpassing its USD 67.39 billion in 2015. Facebook follows with USD 62.56 billion, despite peaking earlier at USD 84.17 billion in 2020. Amazon shows explosive growth from USD 0.5 billion in 2015 to USD 38.96 billion in 2025, reflecting its advertising expansion. TikTok records a rapid rise from zero to USD 23.17 billion, becoming a dominant player in short-form video advertising. YouTube reaches USD 28.23 billion, maintaining steady growth. Smaller platforms like Twitter, Snapchat, and Pinterest also show moderate increases, while Reddit remains niche. This revenue surge reflects shifting ad budgets toward video and performance-based platforms, marking a transformative decade in digital advertising.
| Platform | 2015 Revenue (USD billions) | 2020 Revenue (USD billions) | 2025 Revenue (USD billions) |
|---|---|---|---|
| 17.08 | 84.17 | 62.56 | |
| 67.39 | 47.1 | 99.48 | |
| Amazon | 0.5 | 17.6 | 38.96 |
| 2.22 | 3.46 | 5.34 | |
| Snapchat | 0.06 | 2.5 | 4.3 |
| TikTok | 0 | 9.89 | 23.17 |
| 2.99 | 6.15 | 9.89 | |
| 0.62 | 1.69 | 3.78 | |
| 0.1 | 0.2 | 0.76 | |
| YouTube | 4.04 | 15.1 | 28.23 |


