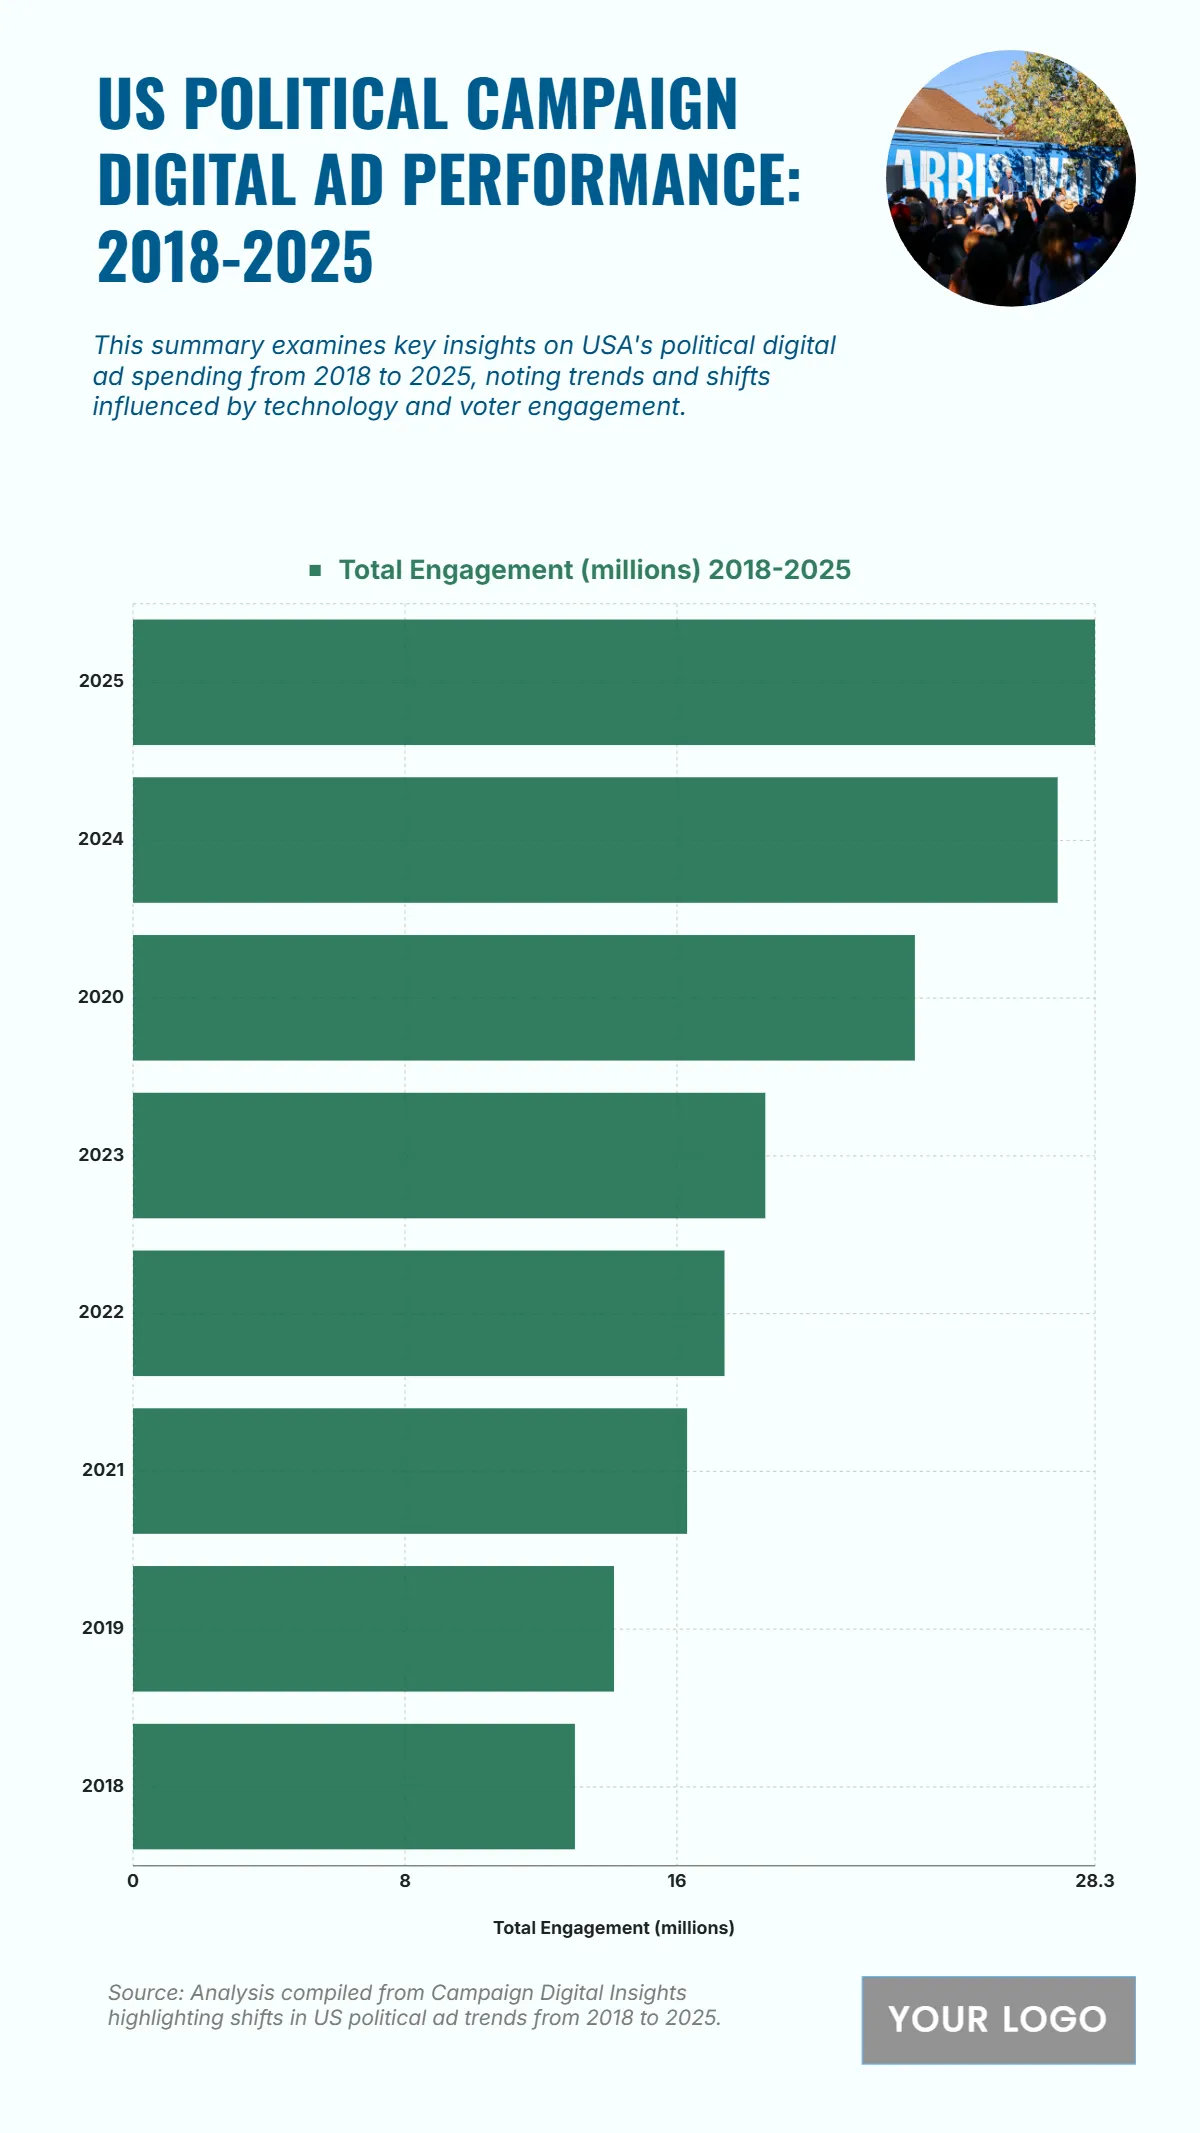
Free US Political Campaign Digital Ad Performance from 2018 to 2025 Chart
The chart demonstrates a steady and significant rise in total political campaign ad engagement from 2018 to 2025. Starting at 13 million in 2018, engagement grew consistently each election cycle, reaching 23 million in 2020, and 27.2 million in 2024, peaking at 28.3 million in 2025. This upward trajectory reflects increased reliance on digital platforms for political messaging and voter outreach. The surge is linked to enhanced targeting, real-time engagement, and the dominance of social media platforms in shaping voter behavior, signaling a transformed landscape for political advertising strategies.
| Year | Total Engagement (millions) |
|---|---|
| 2018 | 13 |
| 2019 | 14.15 |
| 2021 | 16.3 |
| 2022 | 17.4 |
| 2023 | 18.6 |
| 2020 | 23 |
| 2024 | 27.2 |
| 2025 | 28.3 |


