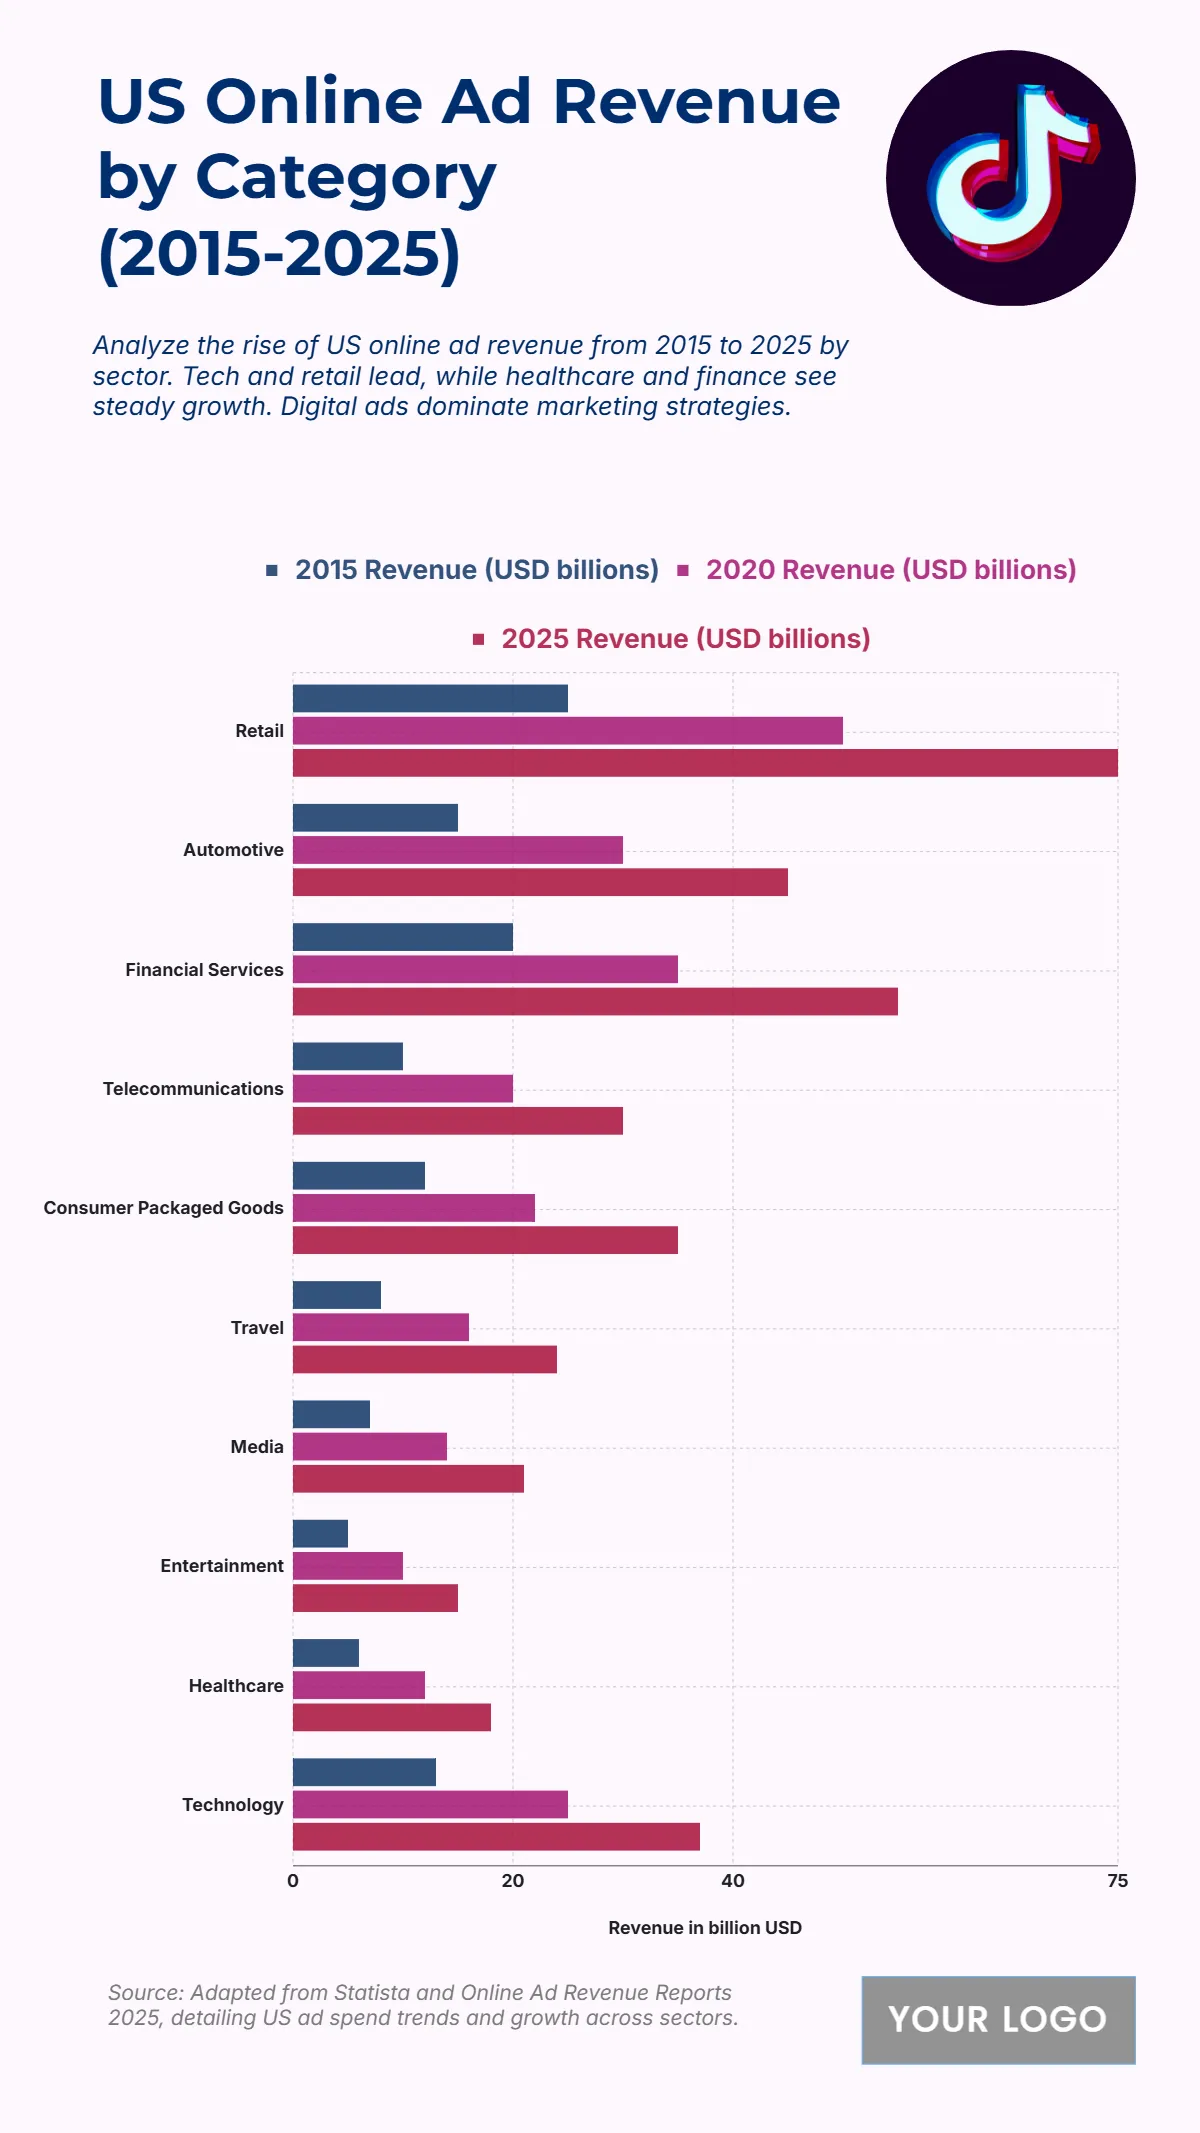
Free US Online Ad Revenue per Business Category from 2015 to 2025 Chart
The chart shows substantial revenue growth across all advertising categories over a ten-year span. Retail leads with USD 75 billion in 2025, tripling its 2015 value, showcasing the sector’s continued dominance. Financial services reach USD 55 billion, and automotive follows with USD 45 billion, indicating strong investment in digital marketing. Telecommunications (USD 30 billion) and consumer packaged goods (USD 35 billion) reflect steady growth fueled by targeted campaigns. Travel climbs to USD 24 billion, while media and entertainment expand to USD 21 billion and USD 15 billion, respectively. Healthcare reaches USD 18 billion, marking increasing digital health promotions, and technology grows to USD 37 billion, underscoring innovation-driven advertising. The data reflects a decisive shift toward digital ad spending, led by retail and tech sectors.
| Category | 2015 (USD billions) | 2020 (USD billions) | 2025 (USD billions) |
|---|---|---|---|
| Retail | 25 | 50 | 75 |
| Automotive | 15 | 30 | 45 |
| Financial Services | 20 | 35 | 55 |
| Telecommunications | 10 | 20 | 30 |
| Consumer Packaged Goods | 12 | 22 | 35 |
| Travel | 8 | 16 | 24 |
| Media | 7 | 14 | 21 |
| Entertainment | 5 | 10 | 15 |
| Healthcare | 6 | 12 | 18 |
| Technology | 13 | 25 | 37 |


