Free US Consumer Behavior Shifts vs Advertising Spend from 2015 to 2025
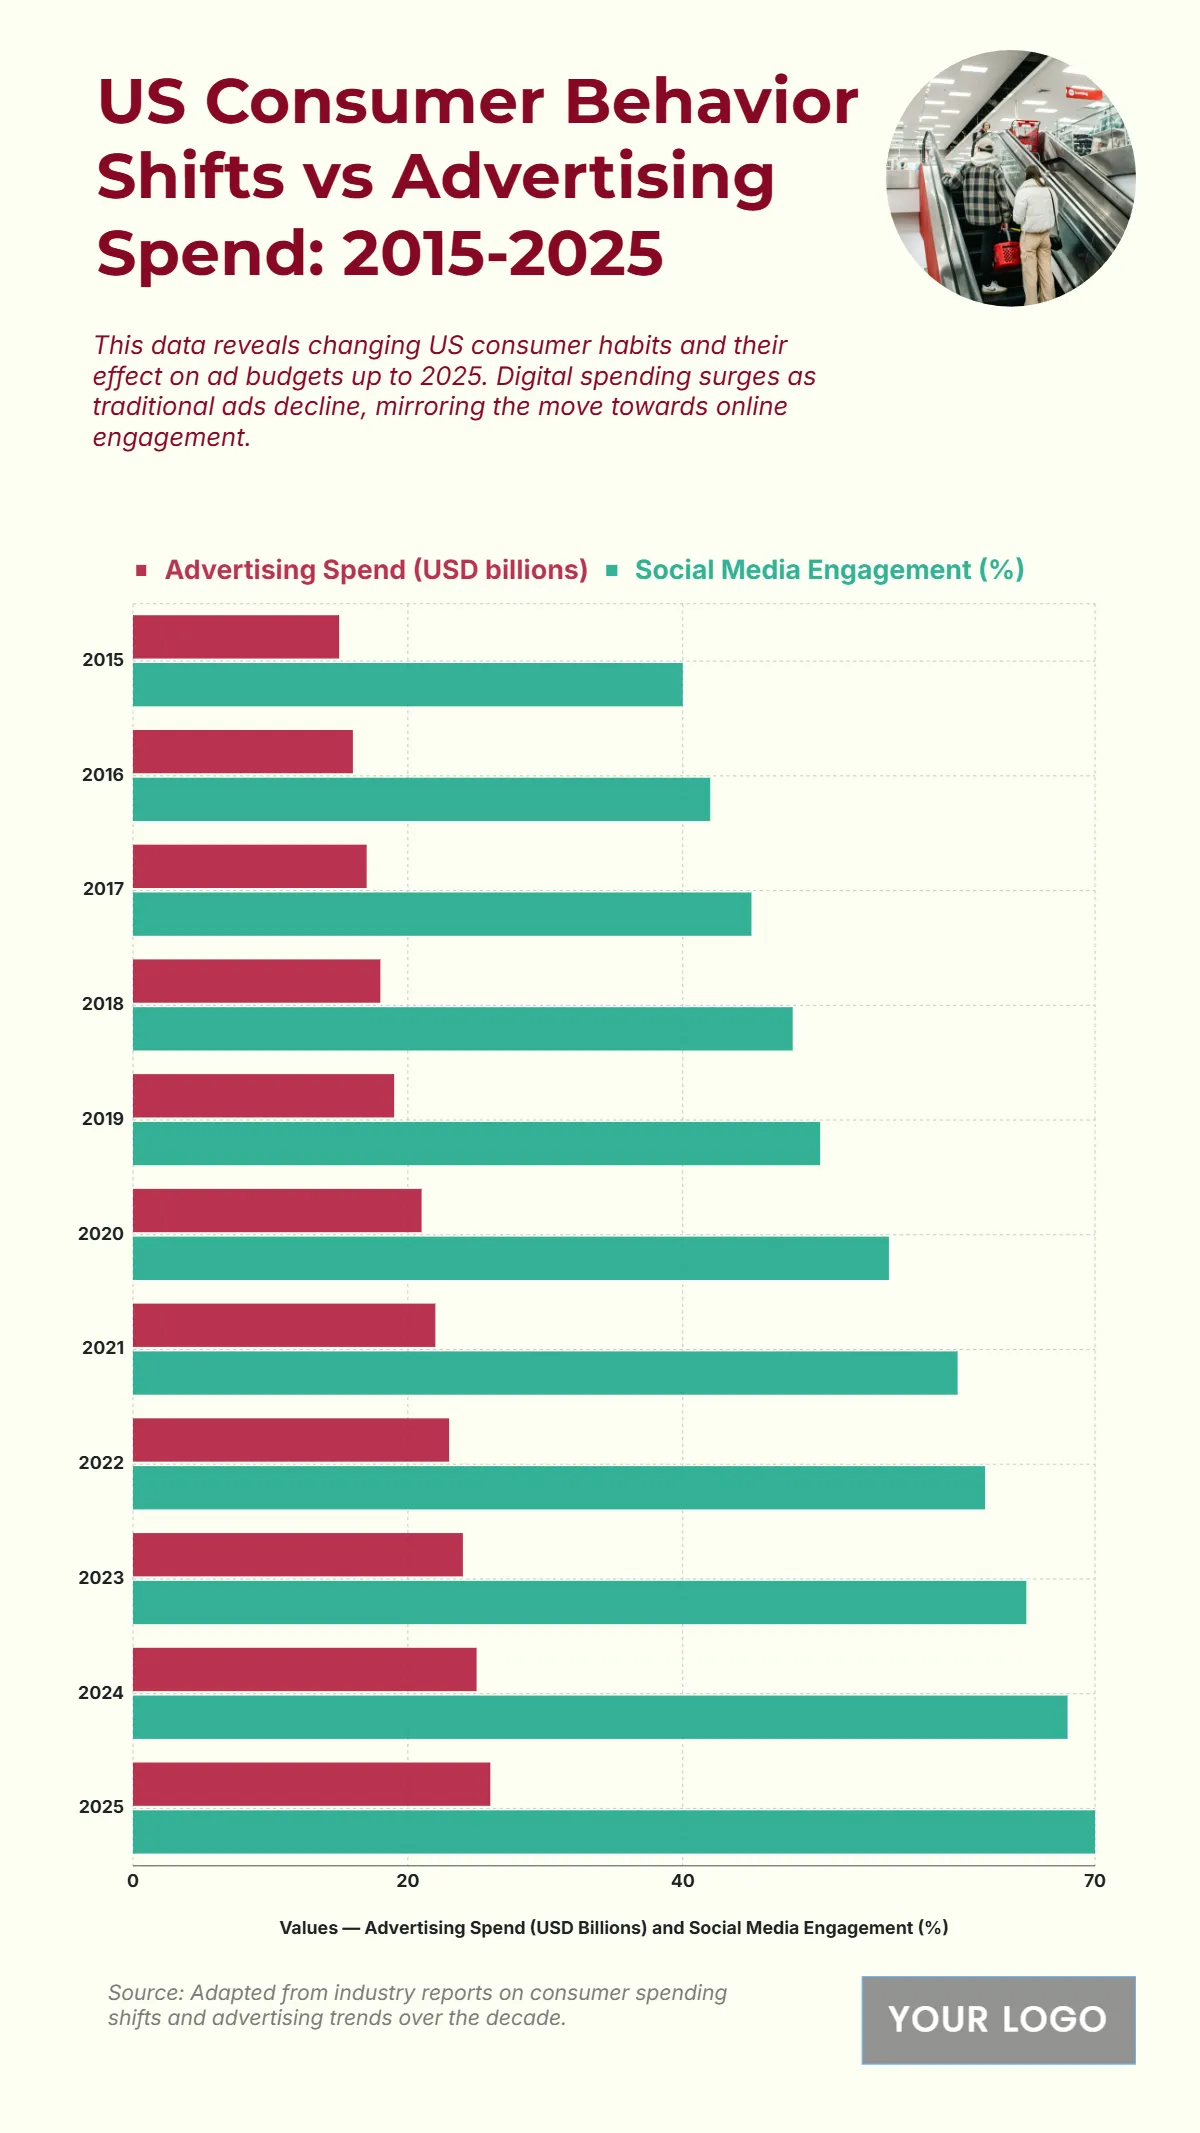
The chart reveals a consistent rise in advertising spend alongside a sharp surge in social media engagement from 2015 to 2025. Ad spend increased from USD 15 billion in 2015 to USD 26 billion in 2025, showing steady growth as brands adapt to evolving consumer behavior. Meanwhile, social media engagement climbed from 40% to 70%, reflecting the deepening integration of digital platforms in daily life. Notable milestones include surpassing the 50% engagement threshold in 2020, and exceeding 65% by 2023, aligning with increased ad investments during the same period. This parallel upward trend emphasizes how shifting consumer attention toward social media directly influences advertising budget allocation, reinforcing the critical role of online engagement in shaping marketing strategies over the decade.
| Year | Advertising Spend (USD billions) | Social Media Engagement (%) |
|---|---|---|
| 2015 | 15 | 40 |
| 2016 | 16 | 42 |
| 2017 | 17 | 45 |
| 2018 | 18 | 48 |
| 2019 | 19 | 50 |
| 2020 | 21 | 55 |
| 2021 | 22 | 60 |
| 2022 | 23 | 62 |
| 2023 | 24 | 65 |
| 2024 | 25 | 68 |
| 2025 | 26 | 70 |


