Free US Advertising Spending by Household Income Bracket from 2015 to 2025 Chart
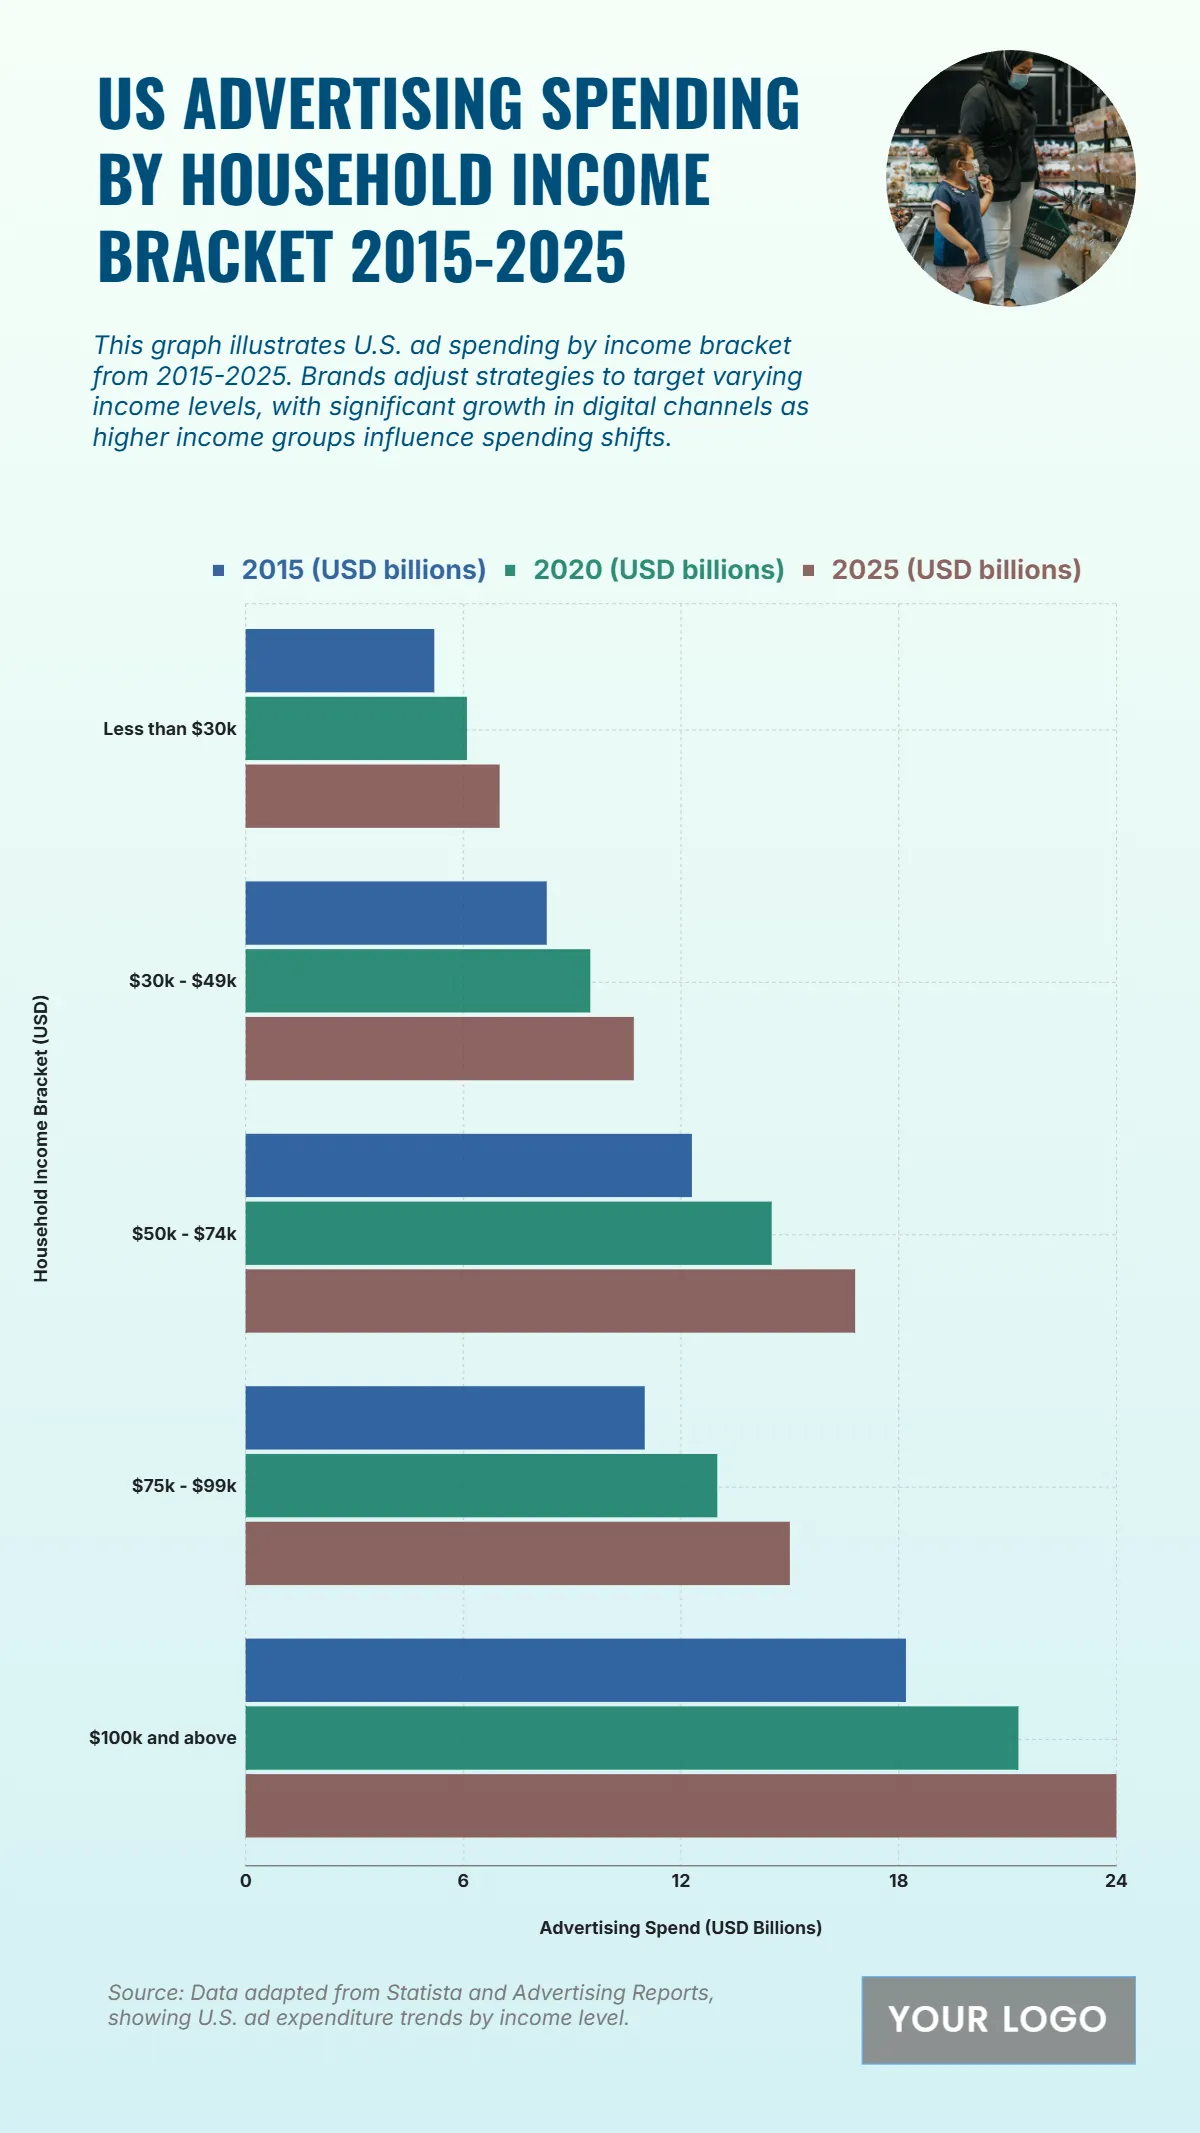
The chart shows significant increases in advertising spending across all income brackets, with the $100k and above group leading at USD 24 billion in 2025, up from USD 18.2 billion in 2015. Middle-income brackets such as $50k–$74k also show strong growth, reaching USD 16.8 billion, emphasizing their influence in consumer markets. Lower brackets grow steadily but at a slower pace, reflecting targeted strategies toward high-spending demographics. This trend highlights advertisers’ strategic focus on affluent consumers while maintaining coverage across income groups, reinforcing the link between disposable income and targeted ad investments.
| Income Bracket | 2015 (USD billions) | 2020 (USD billions) | 2025 (USD billions) |
|---|---|---|---|
| Less than $30k | 5.2 | 6.1 | 7 |
| $30k–$49k | 8.3 | 9.5 | 10.7 |
| $50k–$74k | 12.3 | 14.5 | 16.8 |
| $75k–$99k | 11 | 13 | 15 |
| $100k and above | 18.2 | 21.3 | 24 |


