Free US Connected TV Ad Revenue by Region from 2020 to 2025 Chart
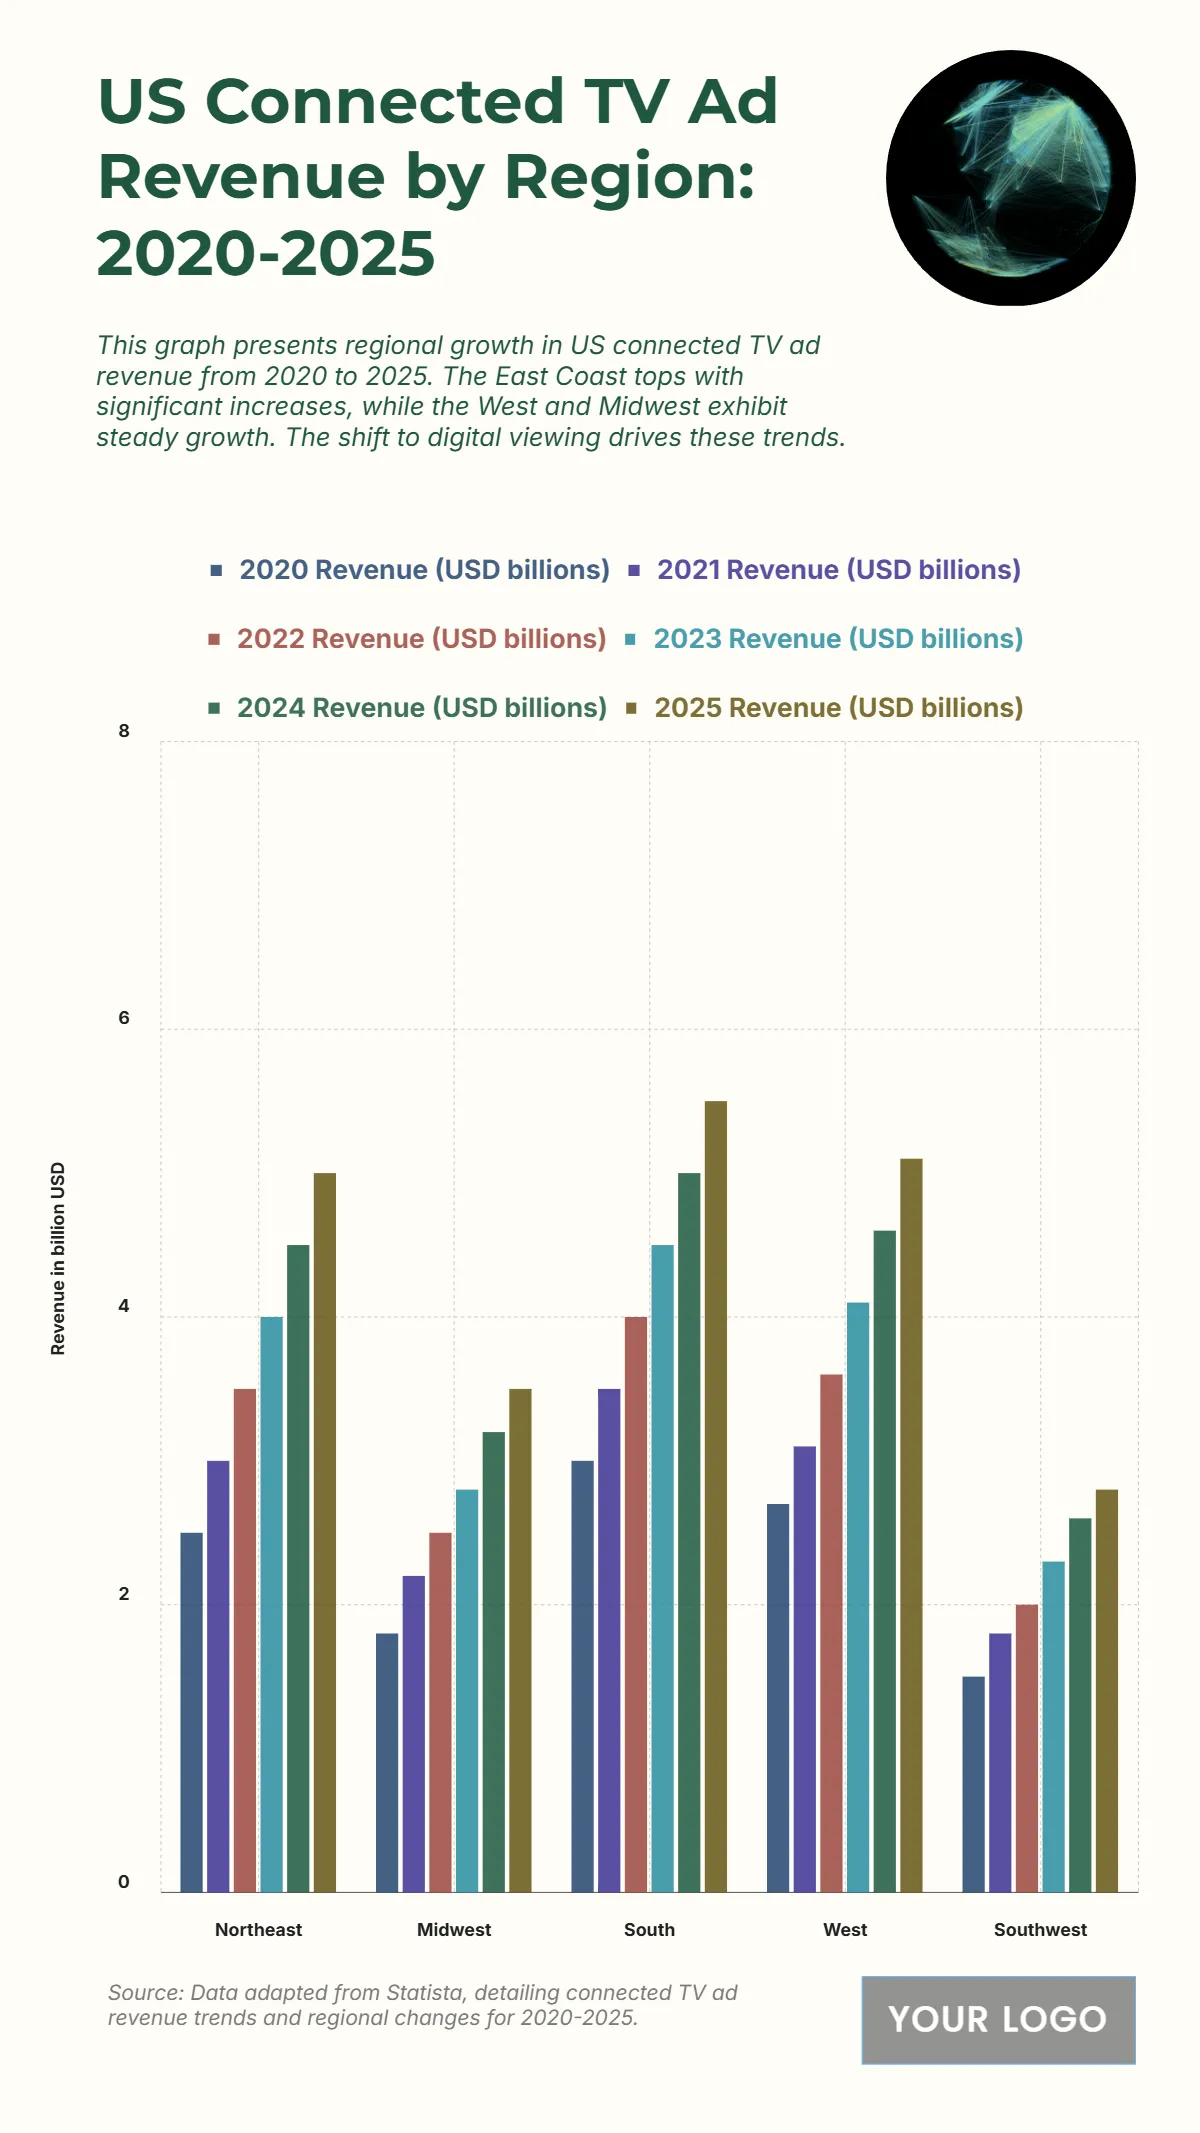
The chart displays the US Connected TV Ad Revenue (USD billions) by region from 2020 to 2025, illustrating a consistent increase in revenue across all five regions over the period. The South and West regions consistently generate the highest revenues. The South region started at 3 billion USD in 2020 and is projected to reach 5.5 billion USD in 2025. The West region started at 2.7 billion USD in 2020 and is projected to reach 5 billion USD in 2025. The Northeast region also shows strong growth, moving from 2.5 billion USD to a projected 4.9 billion USD in 2025. The Midwest and Southwest have the lowest revenue figures, with the Midwest rising from 1.8 billion USD to 3.2 billion USD and the Southwest increasing from 1.5 billion USD to 2.8 billion USD in 2025. Overall, the South and West are the primary drivers of Connected TV ad revenue growth in the US.
| Labels | 2020 Revenue (USD billions) | 2021 Revenue (USD billions) | 2022 Revenue (USD billions) | 2023 Revenue (USD billions) | 2024 Revenue (USD billions) | 2025 Revenue (USD billions) |
| Northeast | 2.5 | 3 | 3.5 | 4 | 4.4 | 4.9 |
| Midwest | 1.8 | 2.2 | 2.5 | 2.8 | 3 | 3.2 |
| South | 3 | 3.5 | 4 | 4.5 | 5 | 5.5 |
| West | 2.7 | 3.1 | 3.6 | 4.1 | 4.5 | 5 |
| Southwest | 1.5 | 1.8 | 2 | 2.3 | 2.5 | 2.8 |


