Free US Video Ad Engagement Rates by Age Group from 2015 to 2025 Chart
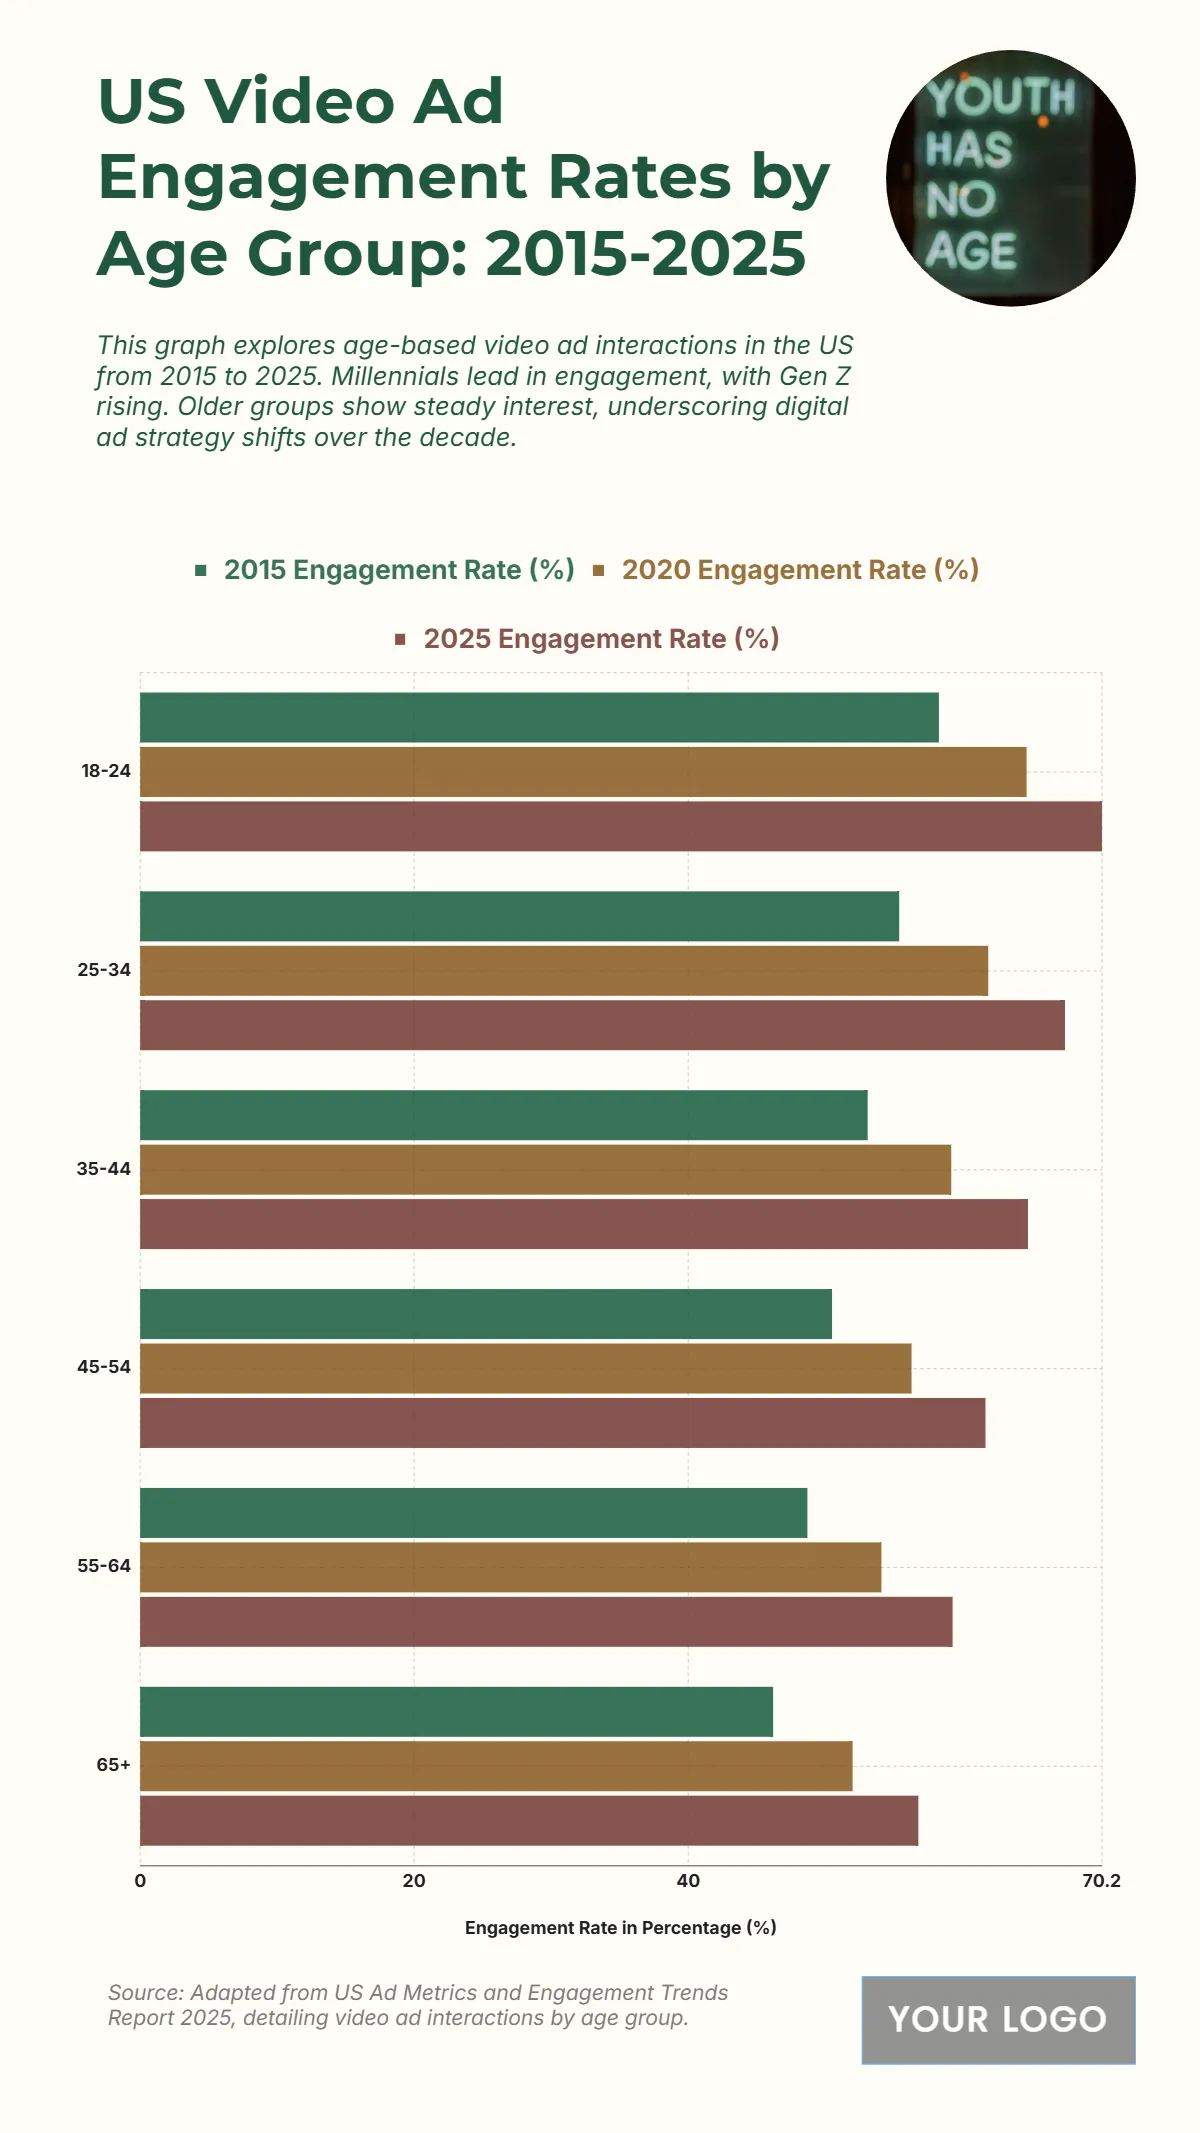
The chart displays the US Video Ad Engagement Rates (%) by age group for 2015, 2020, and 2025, illustrating a continuous increase in engagement across all age demographics. The 18–24 age group consistently maintains the highest engagement rate, rising from 58.3% in 2015 to 64.7% in 2020, and projected to peak at 70.2% in 2025. The 25–34 group follows closely, increasing from 55.4% to 67.5% in 2025. The 65+ age group has the lowest, yet still substantial, engagement rate, growing from 46.2% in 2015 to 56.8% in 2025. All age groups show a notable increase in video ad engagement, with the 18–24 group maintaining a lead of 13.4 percentage points over the 65+ group in the 2025 projection.
| Labels | 2015 Engagement Rate (%) | 2020 Engagement Rate (%) | 2025 Engagement Rate (%) |
| 18–24 | 58.3 | 64.7 | 70.2 |
| 25–34 | 55.4 | 61.9 | 67.5 |
| 35–44 | 53.1 | 59.2 | 64.8 |
| 45–54 | 50.5 | 56.3 | 61.7 |
| 55–64 | 48.7 | 54.1 | 59.3 |
| 65+ | 46.2 | 52 | 56.8 |


