Free US Retail Digital Ad Revenue by Channel from 2015 to 2025 Chart
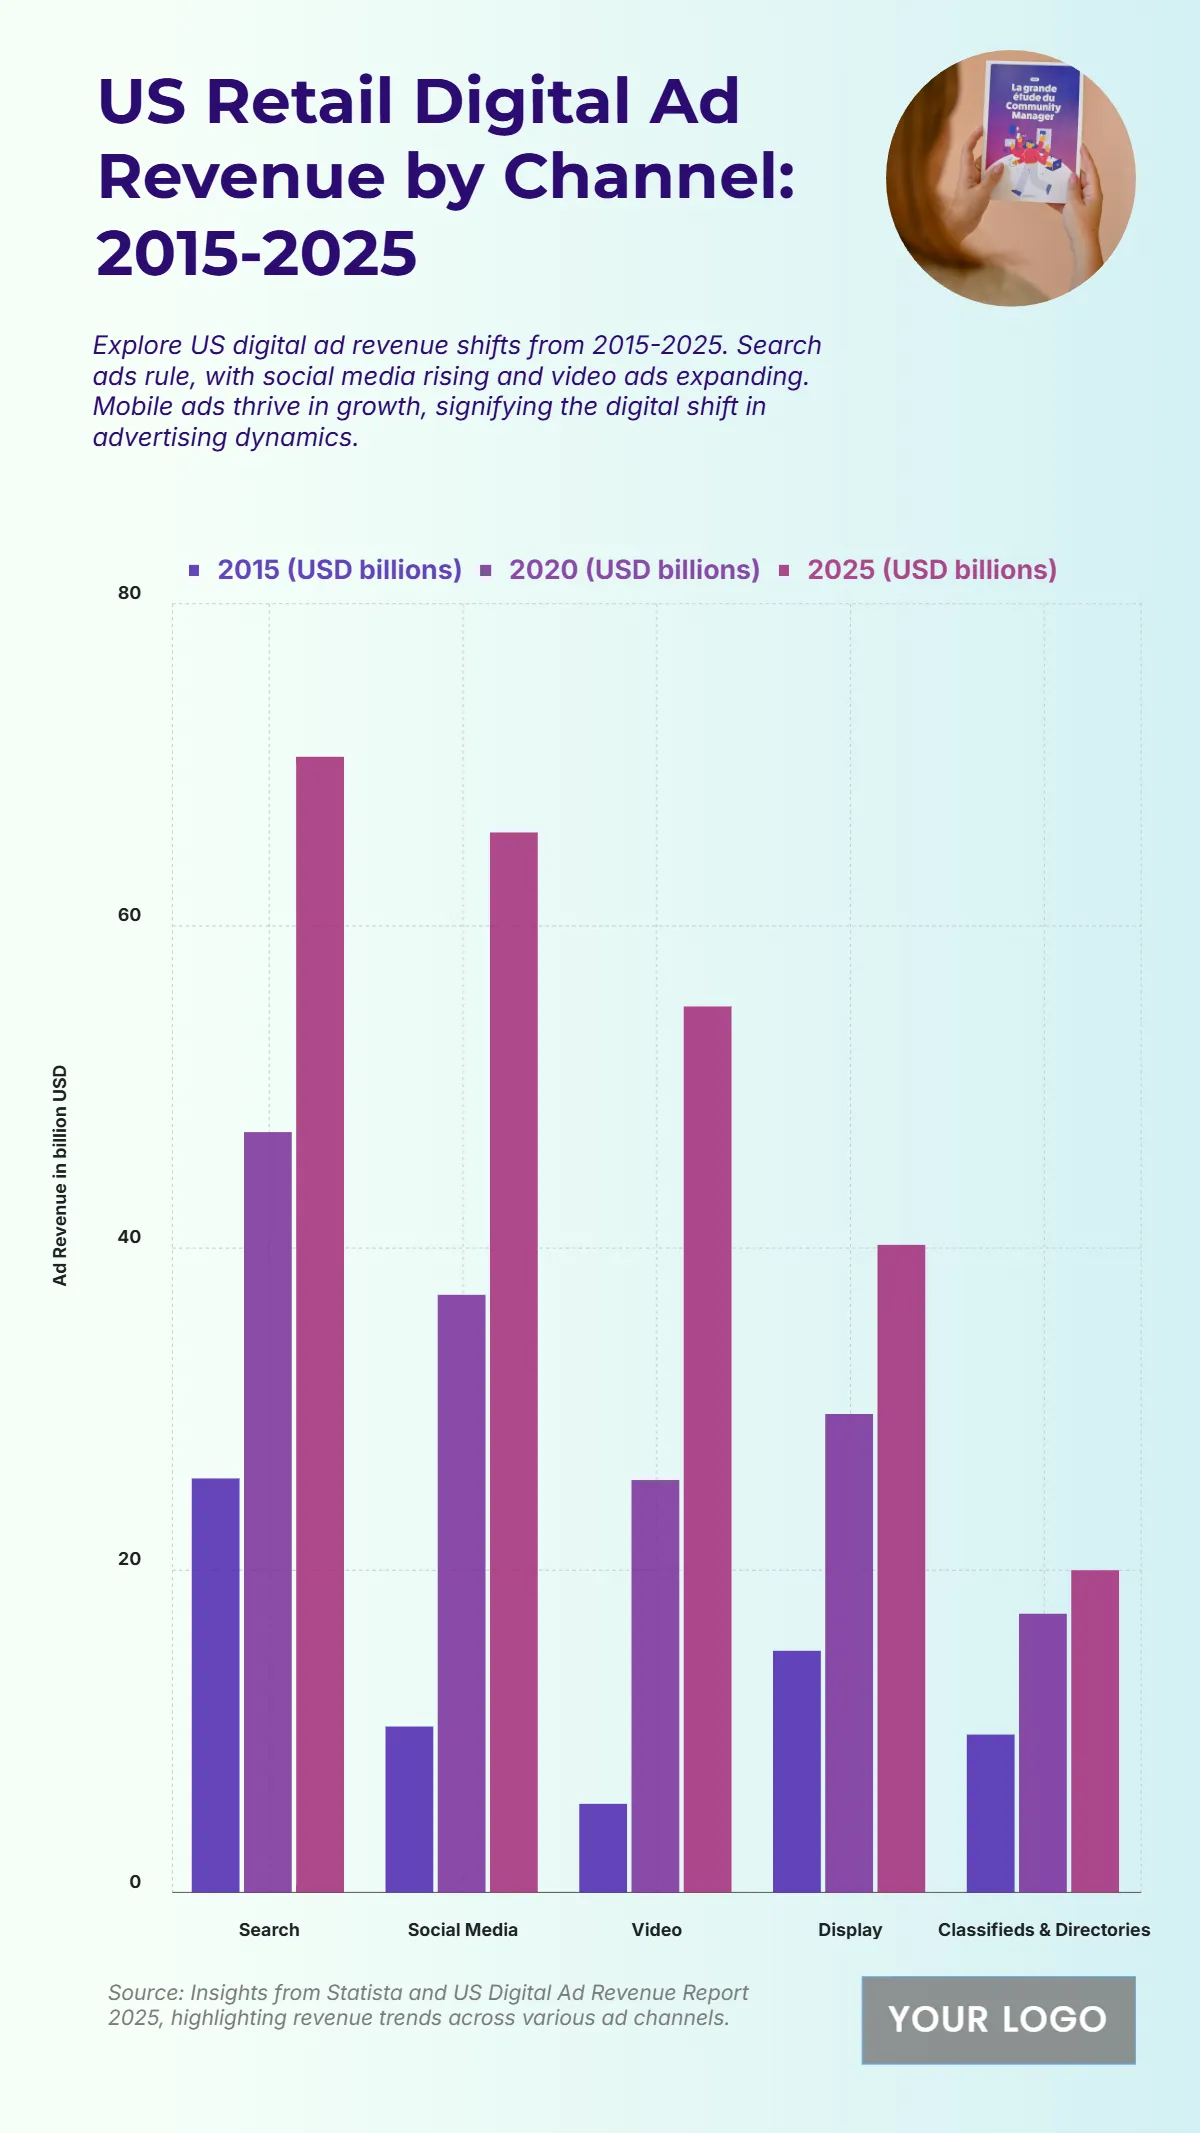
The chart displays the US Retail Digital Ad Revenue (USD billions) by channel for 2015, 2020, and 2025, illustrating a significant and universal increase in ad revenue across all five channels. Search ads maintain the highest revenue throughout, growing from 25.7 billion USD in 2015 to 47.2 billion USD in 2020, and projected to reach 70.5 billion USD in 2025. Social Media shows the largest proportional growth, increasing from 10.3 billion USD in 2015 to 37.1 billion USD in 2020, and projected to reach 65.8 billion USD in 2025. Video ads also exhibit explosive growth, rising from 5.5 billion USD to 55 billion USD in 2025. Even Classifieds & Directories, the lowest revenue channel, sees an increase from 9.8 billion USD to 20 billion USD in 2025. The data highlights the dominance of Search and the rapid acceleration of Social Media and Video in the US retail digital ad market.
| Labels | 2015 (USD billions) | 2020 (USD billions) | 2025 (USD billions) |
| Search | 25.7 | 47.2 | 70.5 |
| Social Media | 10.3 | 37.1 | 65.8 |
| Video | 5.5 | 25.6 | 55 |
| Display | 15 | 29.7 | 40.2 |
| Classifieds & Directories | 9.8 | 17.3 | 20 |


