Free US Gaming Sector Ad Revenue by Device from 2015 to 2025 Chart
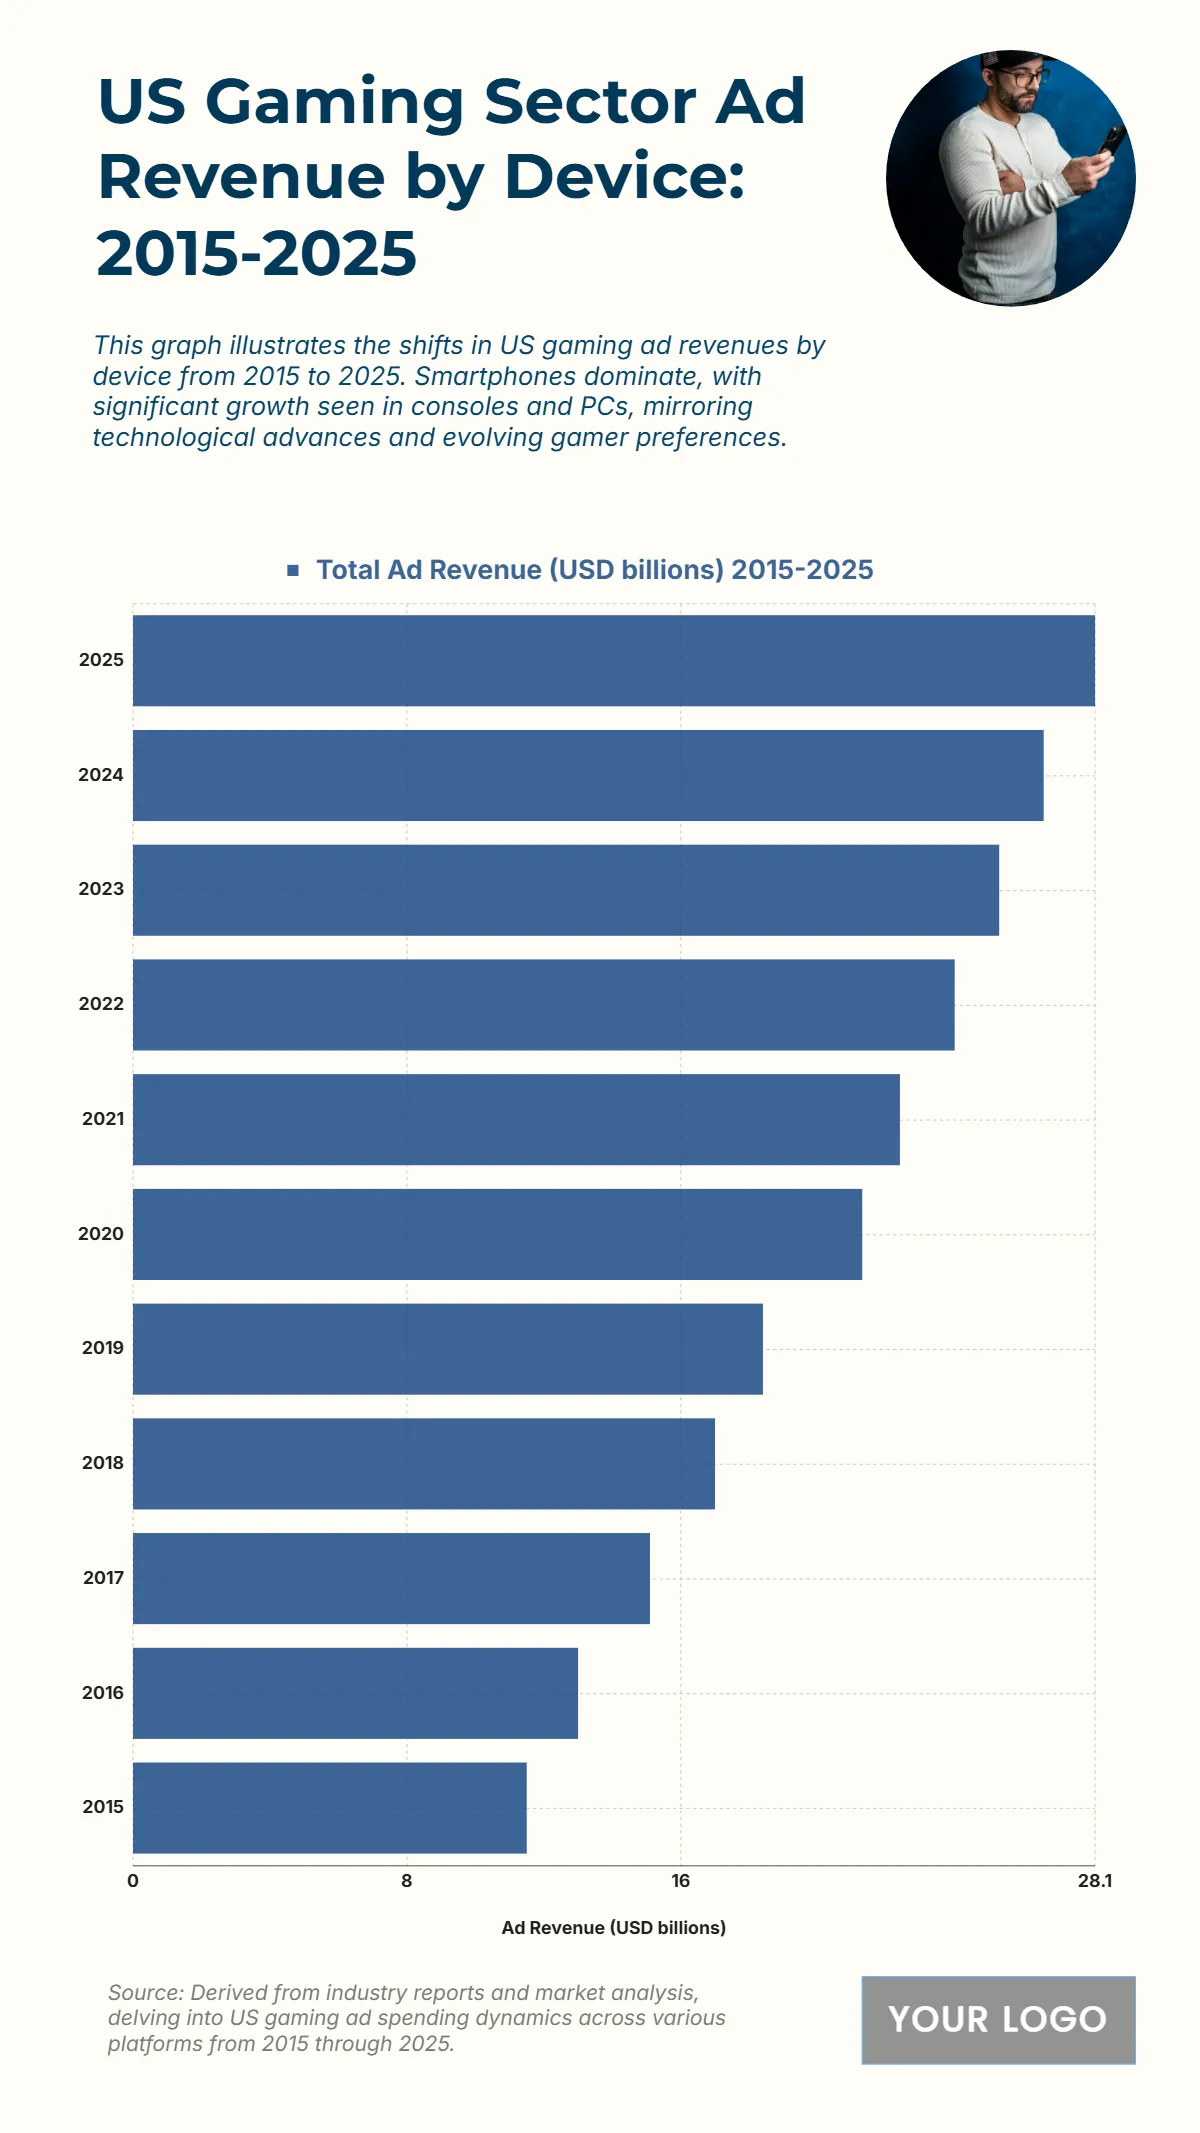
The chart displays the US Gaming Sector Total Ad Revenue (USD billions) from 2015 to 2025, illustrating a significant and continuous growth in ad revenue over the decade. The total ad revenue started at its lowest point in 2015 with 11.5 billion USD. It then increased to 13 billion USD in 2016, 15.1 billion USD in 2017, 17 billion USD in 2018, and 18.4 billion USD in 2019. The revenue crossed the $20 billion mark in 2020 with 21.3 billion USD. The growth accelerated, reaching 22.4 billion USD in 2021 and 24 billion USD in 2022. The revenue is projected to be 25.3 billion USD in 2023, 26.6 billion USD in 2024, and peak at 28.1 billion USD in 2025. Over the ten-year period, the total ad revenue is projected to increase by 16.6 billion USD ($\mathbf{28.1 \text{ billion USD} - 11.5 \text{ billion USD} = 16.6 \text{ billion USD}}$ increase), highlighting the immense and growing commercial importance of the US gaming sector to advertisers.
| Labels | Total Ad Revenue (USD billions) 2015–2025 |
| 2025 | 28.1 |
| 2024 | 26.6 |
| 2023 | 25.3 |
| 2022 | 24 |
| 2021 | 22.4 |
| 2020 | 21.3 |
| 2019 | 18.4 |
| 2018 | 17 |
| 2017 | 15.1 |
| 2016 | 13 |
| 2015 | 11.5 |


