Free US Video Streaming Platform Ad Spend from 2015 to 2025 Chart
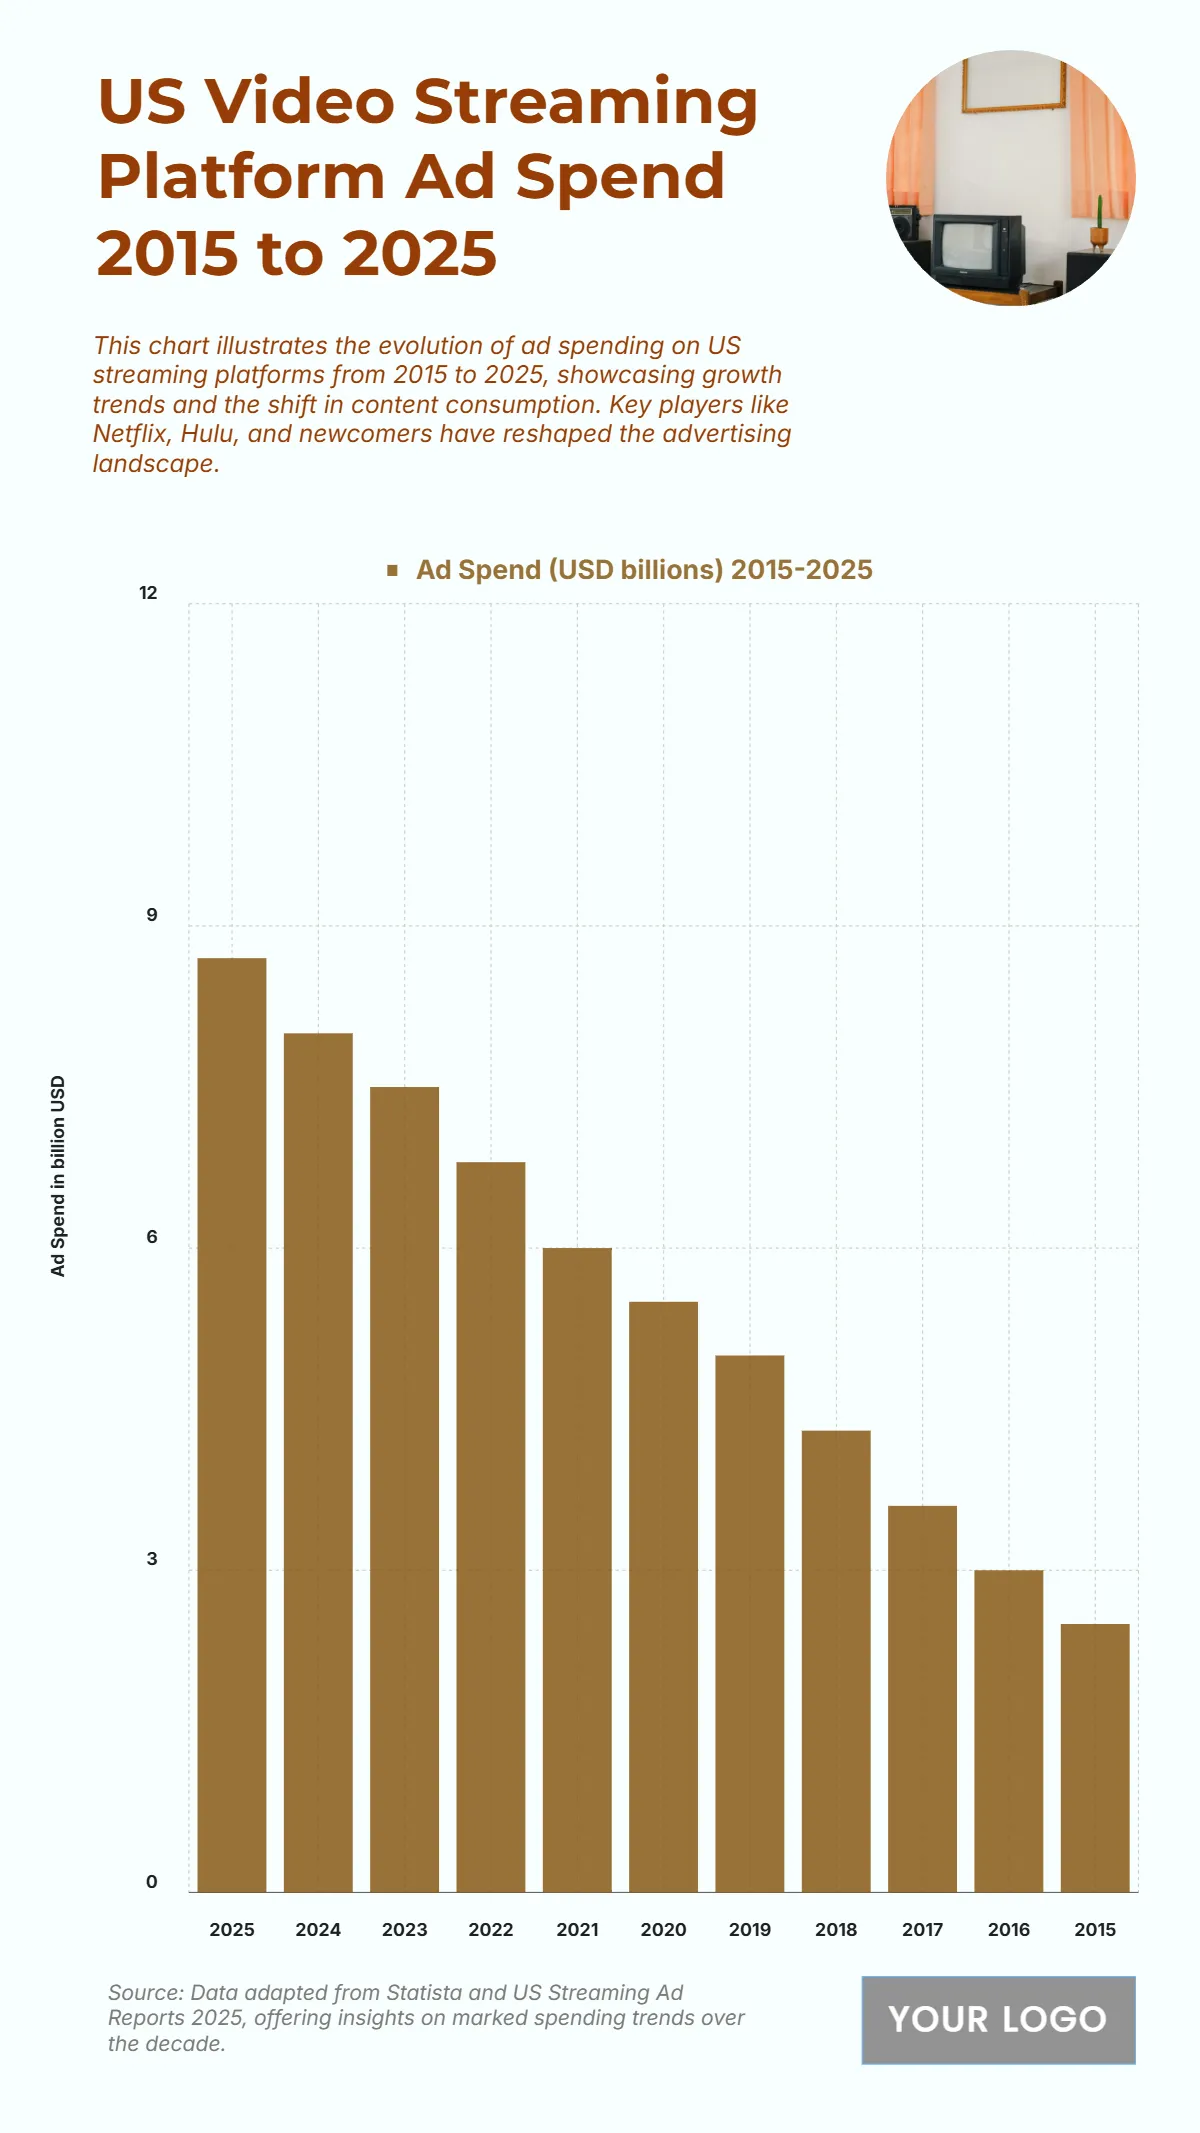
The chart displays the US Video Streaming Platform Ad Spend (USD billions) from 2015 to 2025, illustrating a strong and sustained upward trend over the decade. The ad spend started at its lowest point in 2015 with 2.5 billion USD. It then increased to 3 billion USD in 2016, 3.6 billion USD in 2017, 4.3 billion USD in 2018, and 5 billion USD in 2019. The growth accelerated, reaching 5.5 billion USD in 2020 and 6 billion USD in 2021. The spend continued to climb, reaching 6.8 billion USD in 2022 and 7.5 billion USD in 2023. The upward trend is projected to continue with 8 billion USD in 2024 and peak at 8.7 billion USD in 2025. This represents an over three-fold increase in ad spending from 2015 to 2025 ($\mathbf{8.7 \text{ billion USD} - 2.5 \text{ billion USD} = 6.2 \text{ billion USD}}$ increase), highlighting the rapid shift of ad budgets to streaming platforms.
| Labels | Ad Spend (USD billions) 2015–2025 |
| 2025 | 8.7 |
| 2024 | 8 |
| 2023 | 7.5 |
| 2022 | 6.8 |
| 2021 | 6 |
| 2020 | 5.5 |
| 2019 | 5 |
| 2018 | 4.3 |
| 2017 | 3.6 |
| 2016 | 3 |
| 2015 | 2.5 |


