Free US Online Video Ad Revenue by Platform from 2015 to 2025 Chart
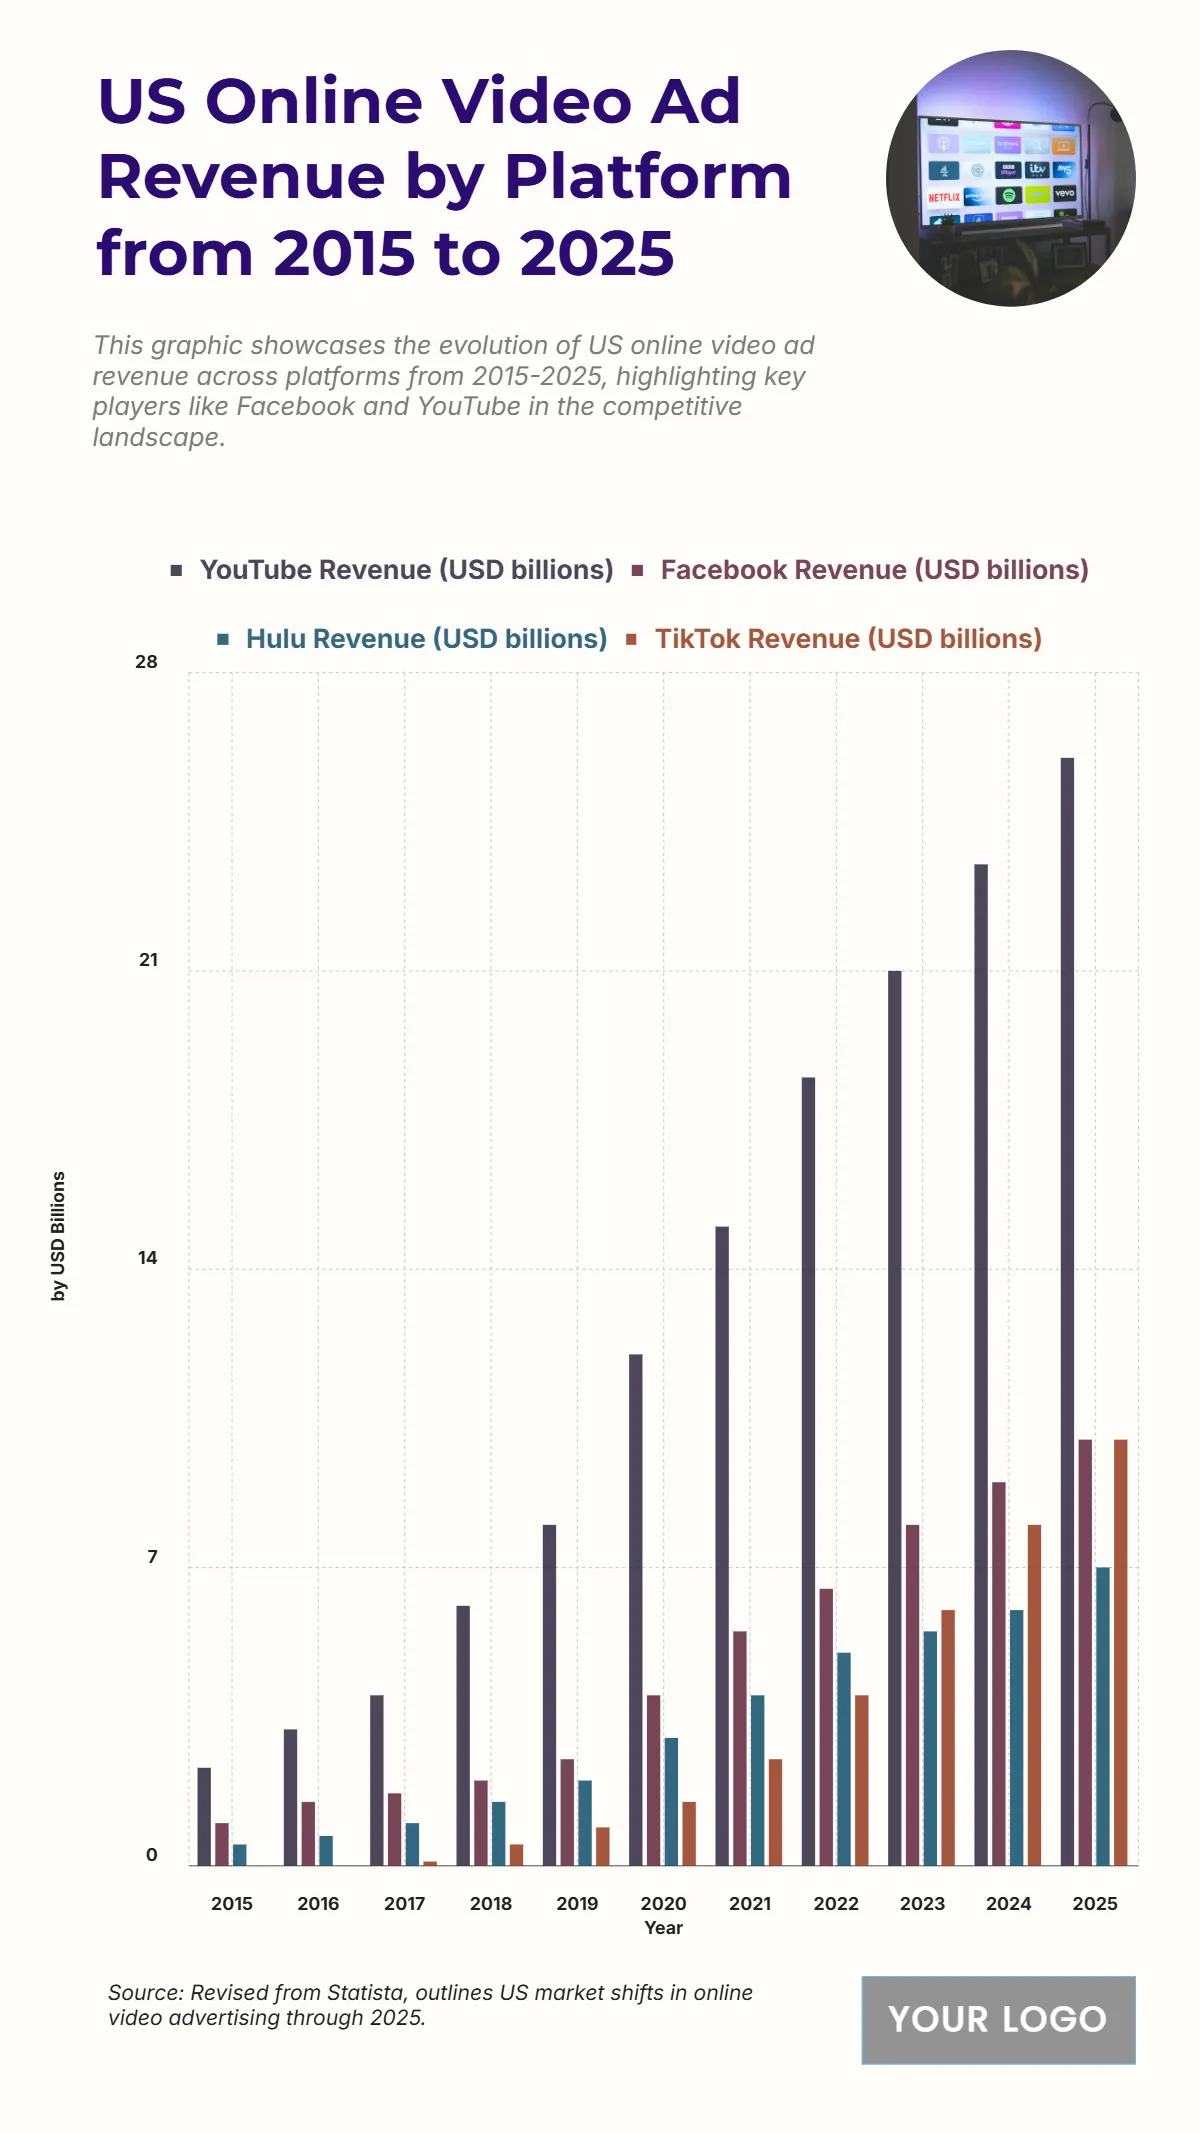
The chart displays the US Online Video Ad Revenue (USD billions) by Platform from 2015 to 2025, illustrating a rapid and sustained increase across all four platforms, with YouTube clearly dominating the market. YouTube Revenue (USD billions) consistently maintains the highest revenue, growing exponentially from 2.3 billion USD in 2015 to 26 billion USD in 2025. TikTok Revenue (USD billions) shows the most dramatic growth rate, surging from 0 billion USD in 2015 to 10 billion USD in 2025 and becoming the second-largest platform by 2025. Facebook Revenue (USD billions) rises from 1 billion USD to 10 billion USD in 2025. Hulu Revenue (USD billions) increases from 0.5 billion USD to 7 billion USD in 2025. The total projected ad revenue across these four platforms in 2025 is 53 billion USD ($\mathbf{26 + 10 + 7 + 10 = 53 \text{ billion USD}}$). The data highlights the shift of video ad spend toward platforms that offer high user engagement and scale.
| Labels | YouTube Revenue (USD billions) | Facebook Revenue (USD billions) | Hulu Revenue (USD billions) | TikTok Revenue (USD billions) |
| 2015 | 2.3 | 1 | 0.5 | 0 |
| 2016 | 3.2 | 1.5 | 0.7 | 0 |
| 2017 | 4 | 1.7 | 1 | 0.1 |
| 2018 | 6.1 | 2 | 1.5 | 0.5 |
| 2019 | 8 | 2.5 | 2 | 0.9 |
| 2020 | 12 | 4 | 3 | 1.5 |
| 2021 | 15 | 5.5 | 4 | 2.5 |
| 2022 | 18.5 | 6.5 | 5 | 4 |
| 2023 | 21 | 8 | 5.5 | 6 |
| 2024 | 23.5 | 9 | 6 | 8 |
| 2025 | 26 | 10 | 7 | 10 |


