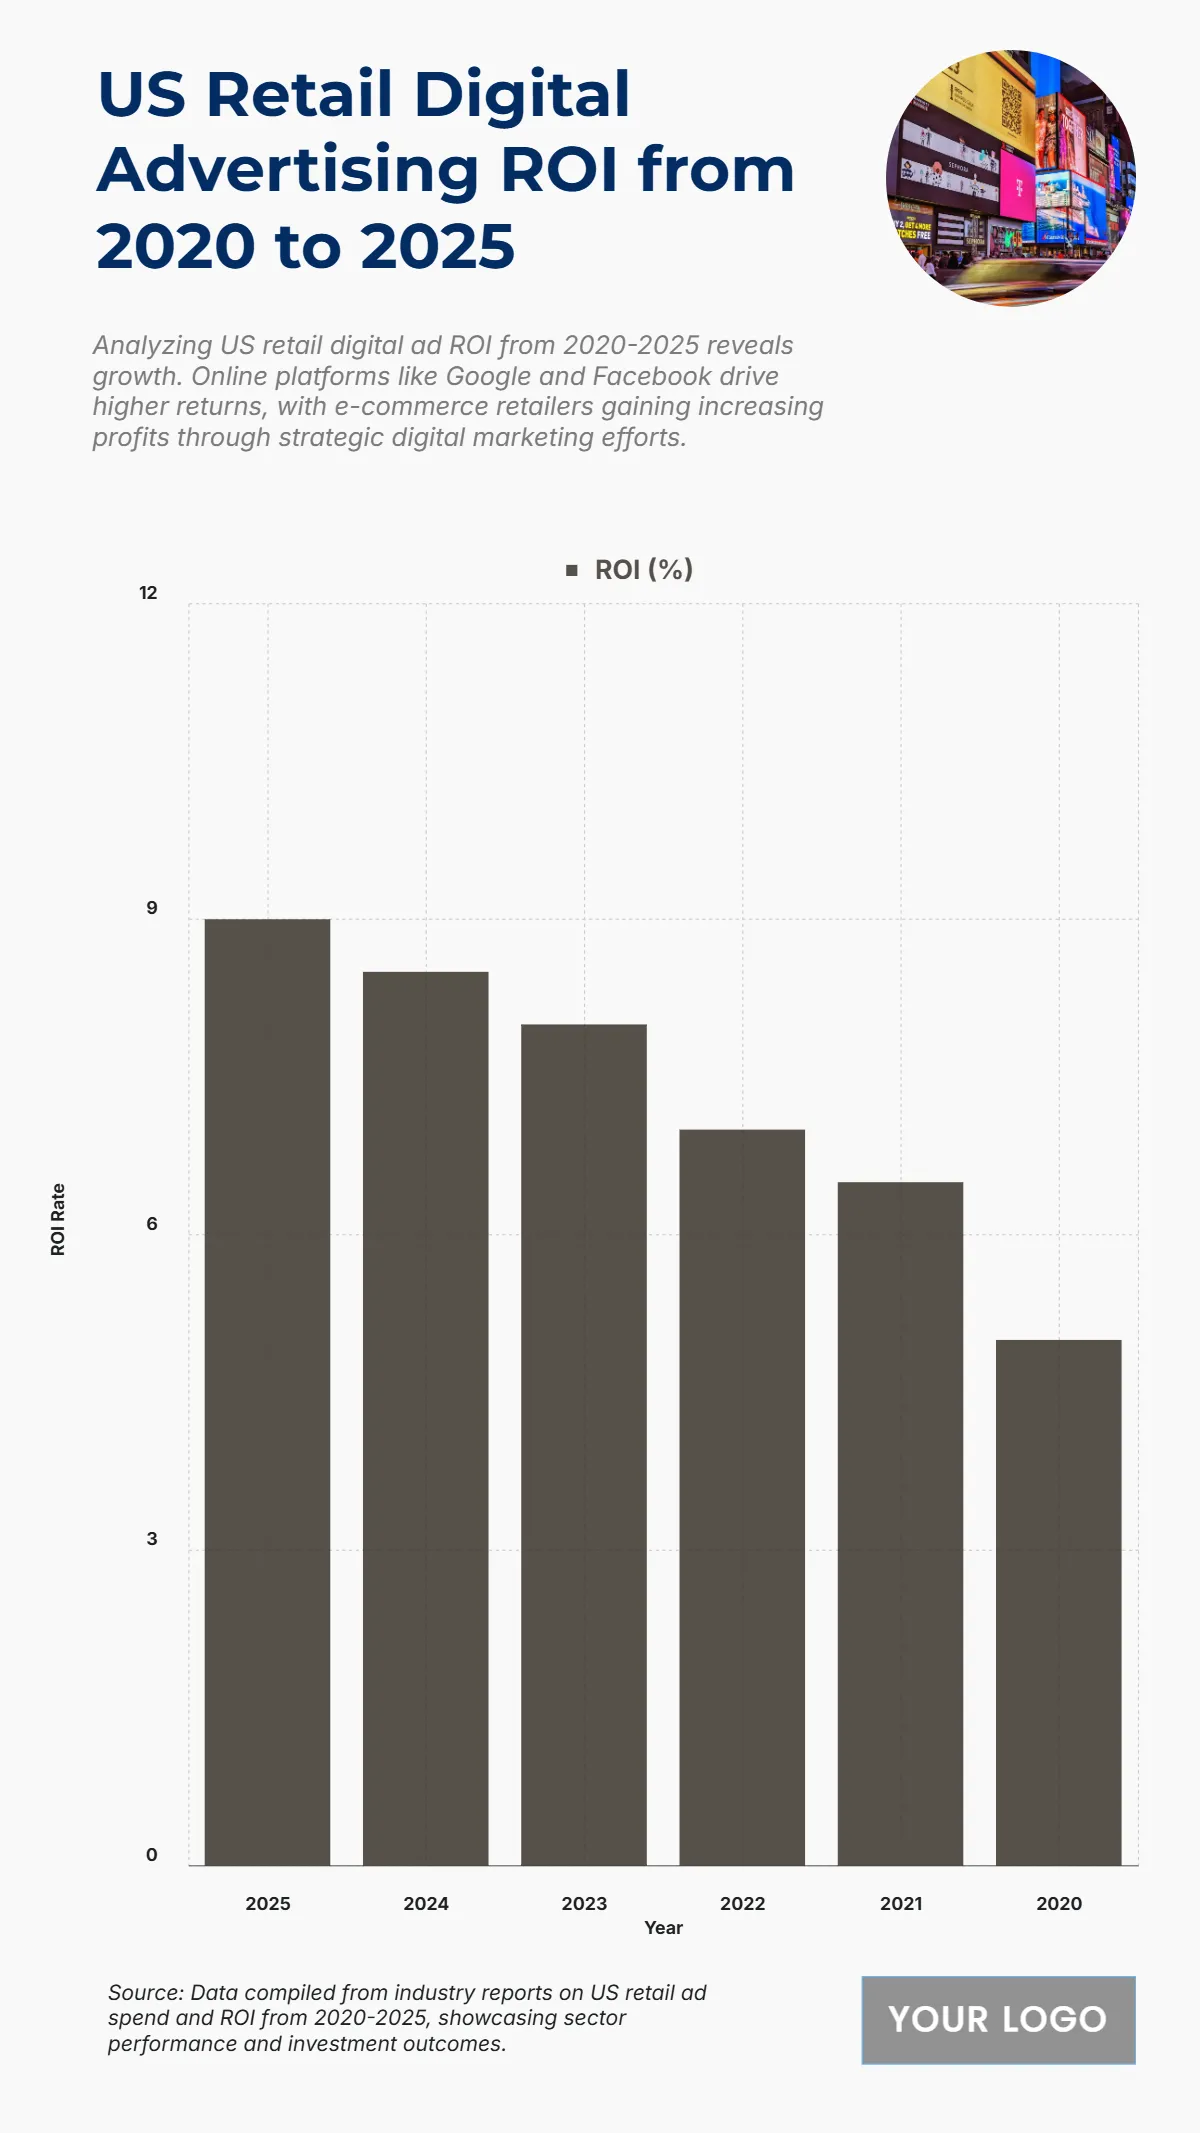
Free US Retail Digital Advertising ROI from 2020 to 2025 Chart
The chart illustrates a steady increase in ROI from 5% in 2020 to 9% in 2025, highlighting growing efficiency in digital ad spend across the retail sector. In 2020, ROI stood at 5%, reflecting the early stages of scaling digital campaigns. By 2021, this rose to 6.5%, driven by greater adoption of targeted advertising. A further climb to 7% in 2022 reflects increased e-commerce traffic and refined audience segmentation. By 2023 and 2024, ROI improved to 8% and 8.5%, showcasing heightened returns on platforms like search, social, and programmatic ads. The peak of 9% in 2025 underscores how strategic investment in digital channels delivers higher profitability. This upward trend signals a maturing retail advertising ecosystem, where companies leverage advanced tools, AI-driven targeting, and optimized budget allocation to improve performance. As digital landscapes evolve, this growth trajectory points toward sustained efficiency gains and stronger returns on advertising investments.
| Year | ROI (%) |
|---|---|
| 2025 | 9 |
| 2024 | 8.5 |
| 2023 | 8 |
| 2022 | 7 |
| 2021 | 6.5 |
| 2020 | 5 |


