Free US E-commerce Advertising Growth Rate from 2015 to 2025 Chart
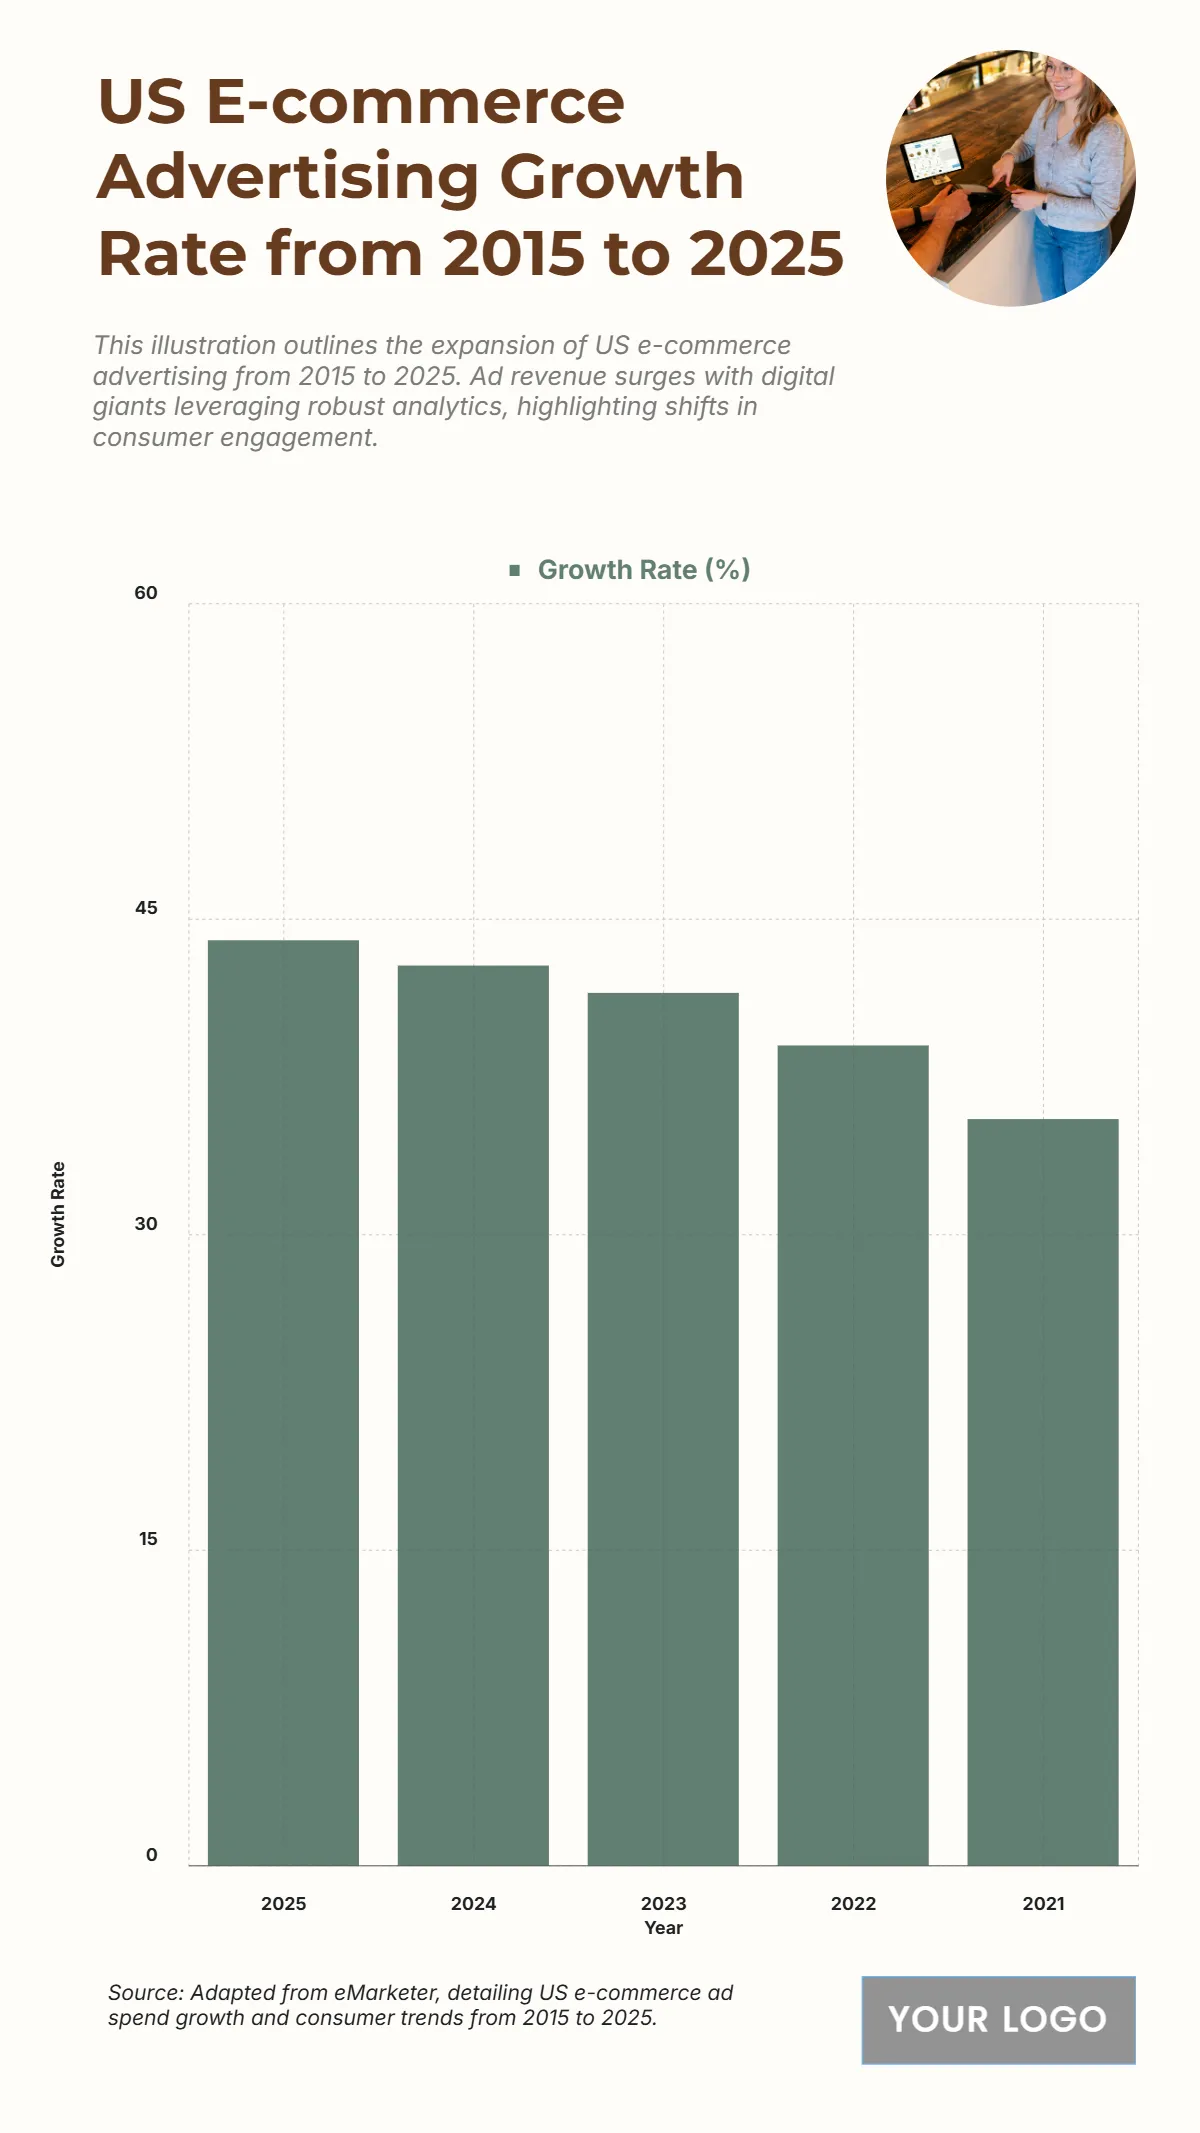
The chart showcases the sustained upward trend in US e-commerce advertising growth rates, reflecting the digital retail boom over recent years. From 35.5% in 2021, growth rose steadily to 39% in 2022, fueled by increasing online consumer activity and enhanced ad technology integration. 2023 saw a growth rate of 41.5%, with retail brands expanding ad budgets across omnichannel platforms. In 2024, it climbed further to 42.8%, supported by better personalization tools, while 2025 reached 44%, its peak within the period. This consistent climb highlights how businesses continue to allocate more resources toward digital storefronts and conversion optimization, driven by high consumer demand and online convenience. The overall upward pattern underlines the maturity of the digital commerce ecosystem, marking it as a dominant force in global advertising trends.
| Year | Growth Rate (%) |
|---|---|
| 2025 | 44 |
| 2024 | 42.8 |
| 2023 | 41.5 |
| 2022 | 39 |
| 2021 | 35.5 |


