Free US Retail Advertising by Product Category from 2020 to 2025 Chart
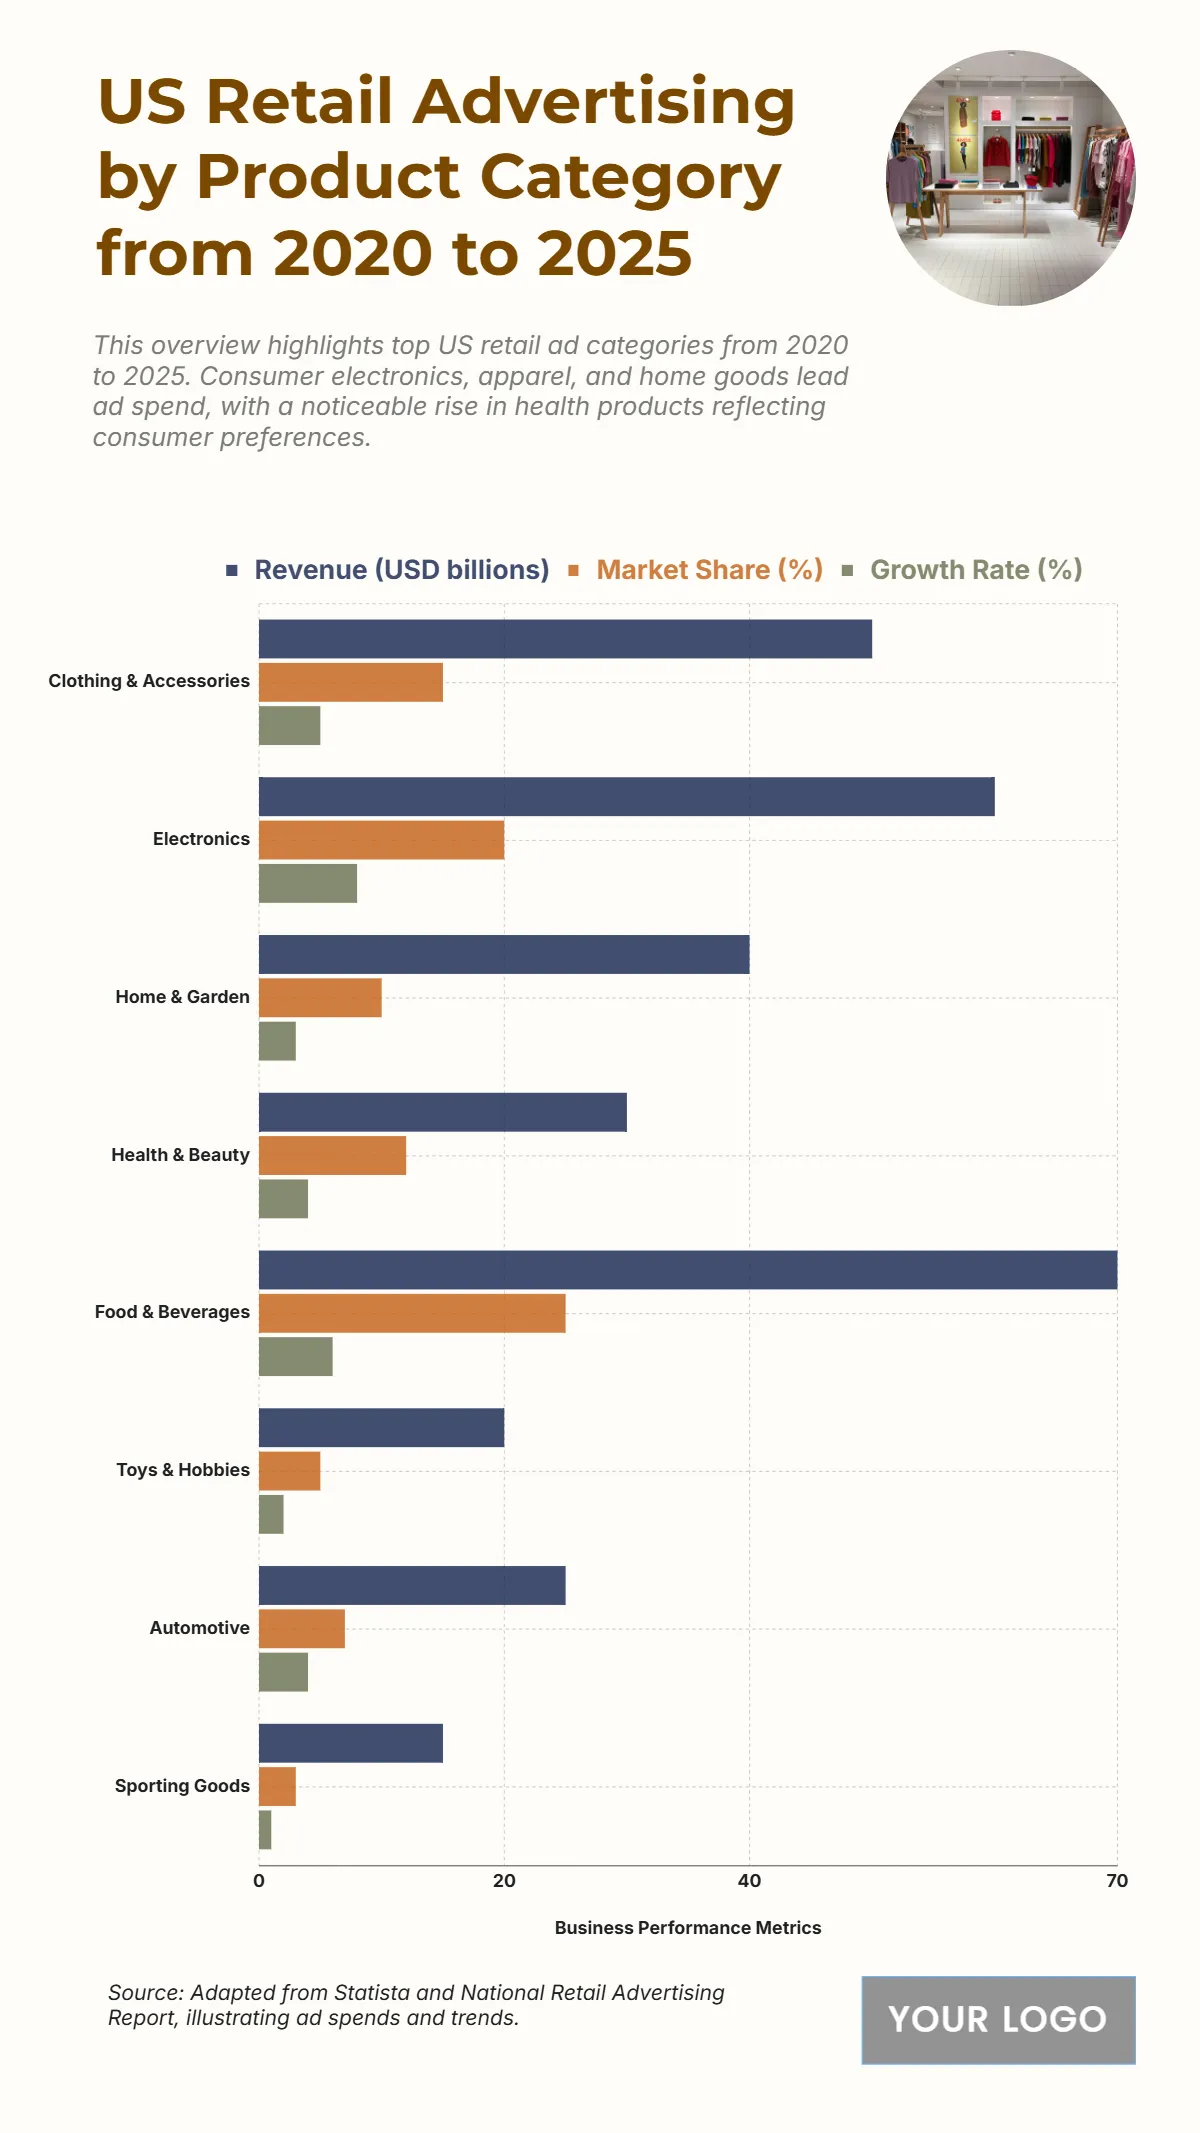
The chart provides a comparative analysis of US retail advertising revenue, market share, and growth rates by product category. Food & Beverages leads the market with USD 70 billion revenue and a 25% market share, supported by strong demand for lifestyle and convenience products. Electronics follows closely with USD 60 billion and 20% share, driven by innovation in consumer technology. Clothing & Accessories ranks third, generating USD 50 billion and 15% market share, reflecting the sustained influence of fashion marketing. Home & Garden contributes USD 40 billion (10%), while Health & Beauty secures USD 30 billion (12%), showing resilience amid health-conscious trends. Smaller but notable sectors include Automotive (USD 25 billion, 7%), Toys & Hobbies (USD 20 billion, 5%), and Sporting Goods (USD 15 billion, 3%). Growth rates range from 1% to 8%, with Electronics (8%) and Food & Beverages (6%) outperforming others. The data signifies consumer shift toward technology, wellness, and food segments, positioning these as key drivers of advertising growth across 2020–2025.
| Category | Revenue (USD billions) | Market Share (%) | Growth Rate (%) |
|---|---|---|---|
| Clothing & Accessories | 50 | 15 | 5 |
| Electronics | 60 | 20 | 8 |
| Home & Garden | 40 | 10 | 3 |
| Health & Beauty | 30 | 12 | 4 |
| Food & Beverages | 70 | 25 | 6 |
| Toys & Hobbies | 20 | 5 | 2 |
| Automotive | 25 | 7 | 4 |
| Sporting Goods | 15 | 3 | 1 |


