Free US Online Advertising Market Share by Platform from 2015 to 2025 Chart
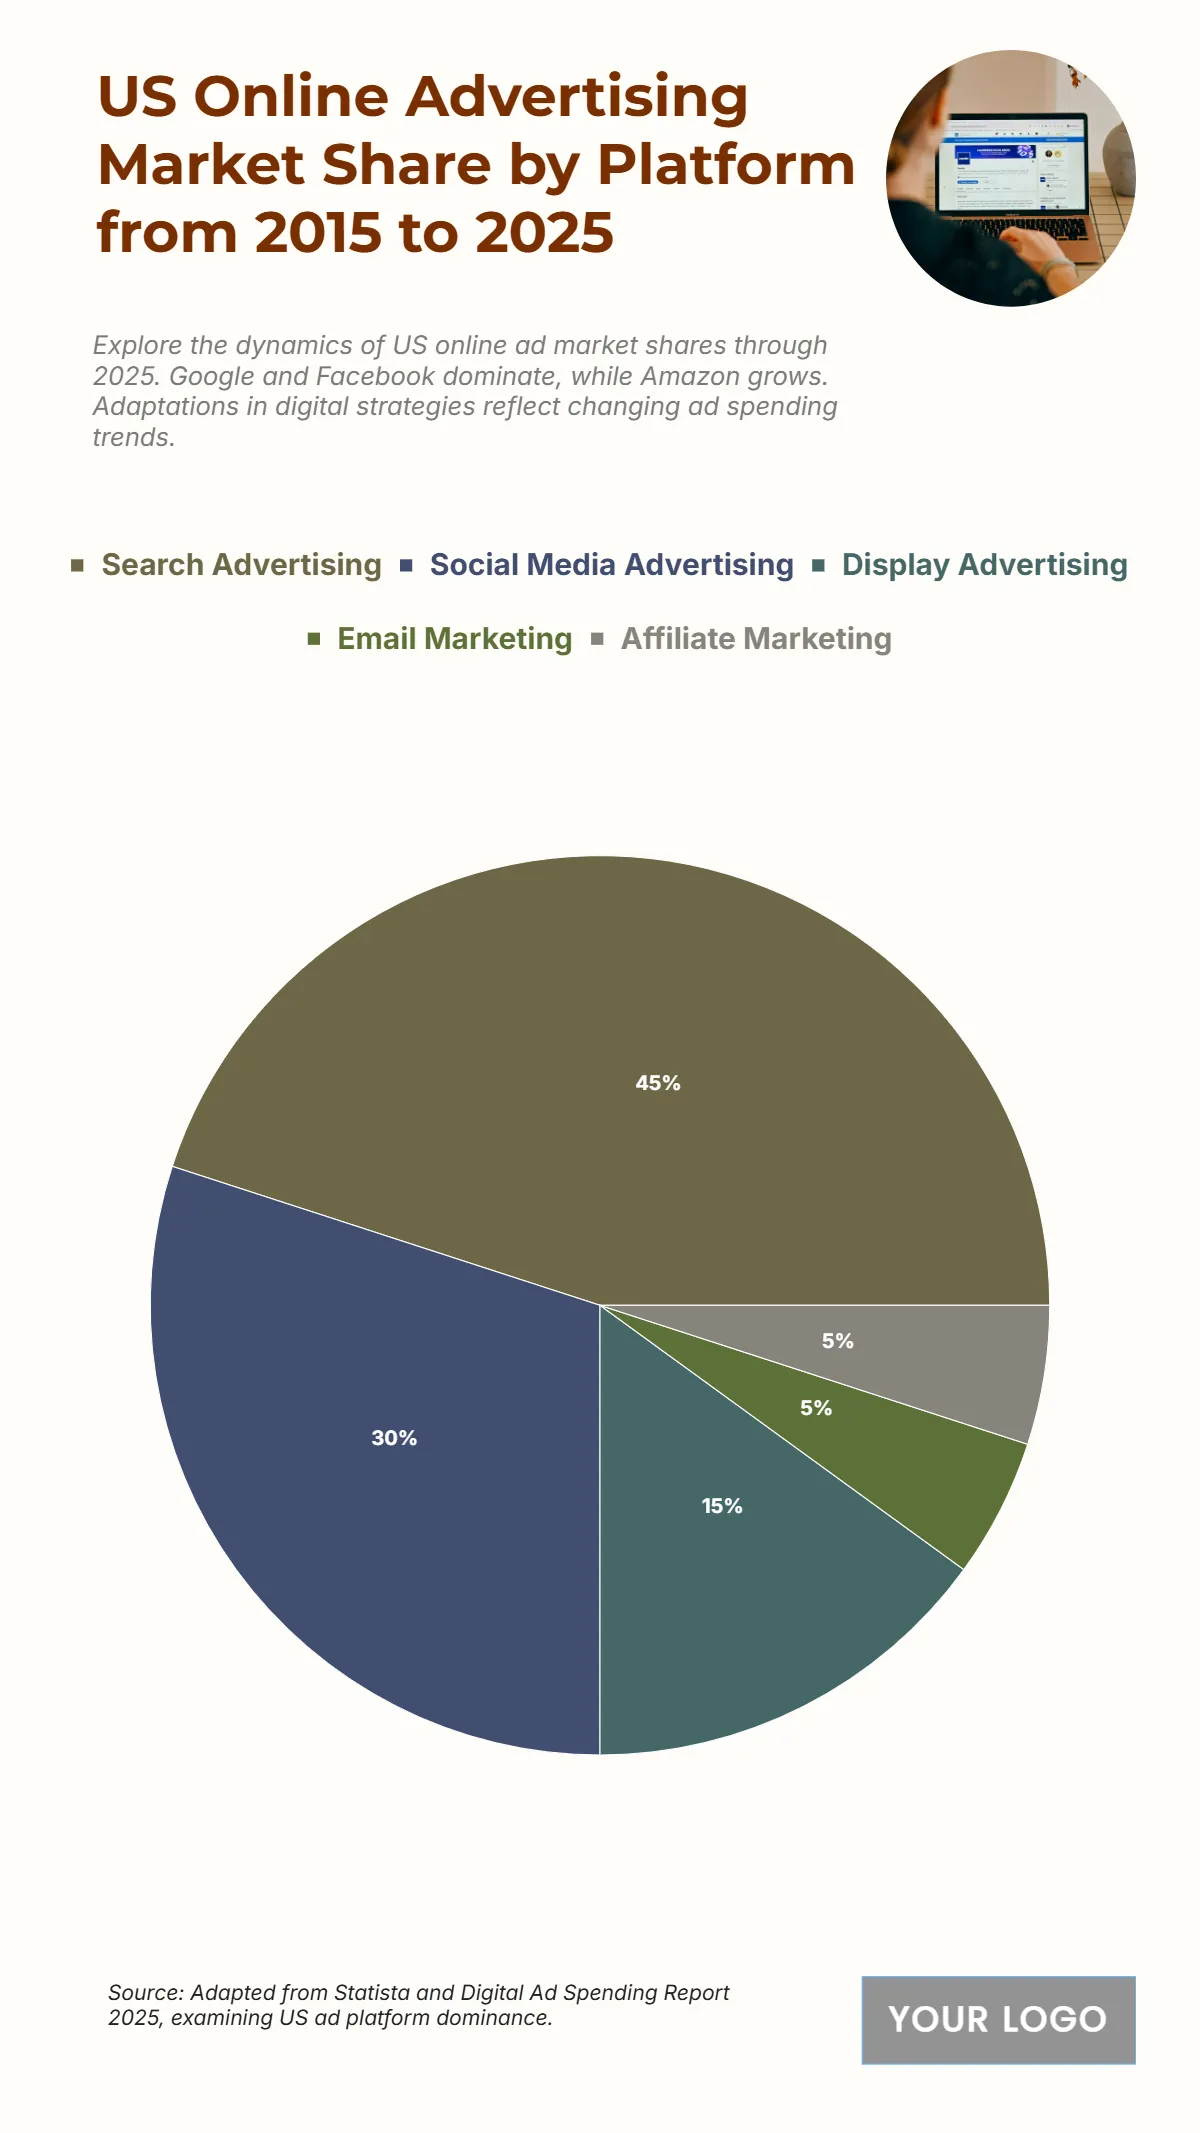
The chart illustrates the average market share of different online advertising platforms over a ten-year period, clearly showing the dominance of search advertising in the digital landscape. Search advertising holds the largest share at 45%, reflecting its continued importance as a performance-driven channel for businesses targeting high-intent audiences. Social media advertising follows at 30%, underscoring the explosive growth of platforms like Facebook, Instagram, TikTok, and LinkedIn, which have become key avenues for both brand building and conversion campaigns. Display advertising, accounting for 15%, remains a crucial element of awareness strategies, leveraging programmatic buying and rich media formats. Email marketing and affiliate marketing each hold 5%, showing steady but smaller roles in the broader ecosystem. This distribution indicates a clear concentration of spending in search and social channels, which together command 75% of the market, driven by measurable ROI and targeting precision. Meanwhile, display, email, and affiliate marketing provide supporting roles, often integrated into multi-channel digital strategies to boost visibility and engagement. The data reveals how advertising budgets have shifted toward more data-centric, intent-based platforms, reflecting advertiser priorities for both reach and conversion.
| Platform | 2015–2025 Average Market Share (%) |
|---|---|
| Search Advertising | 45 |
| Social Media Advertising | 30 |
| Display Advertising | 15 |
| Email Marketing | 5 |
| Affiliate Marketing | 5 |


