Free US Ad Spending on Streaming Audio vs Radio from 2015 to 2025 Chart
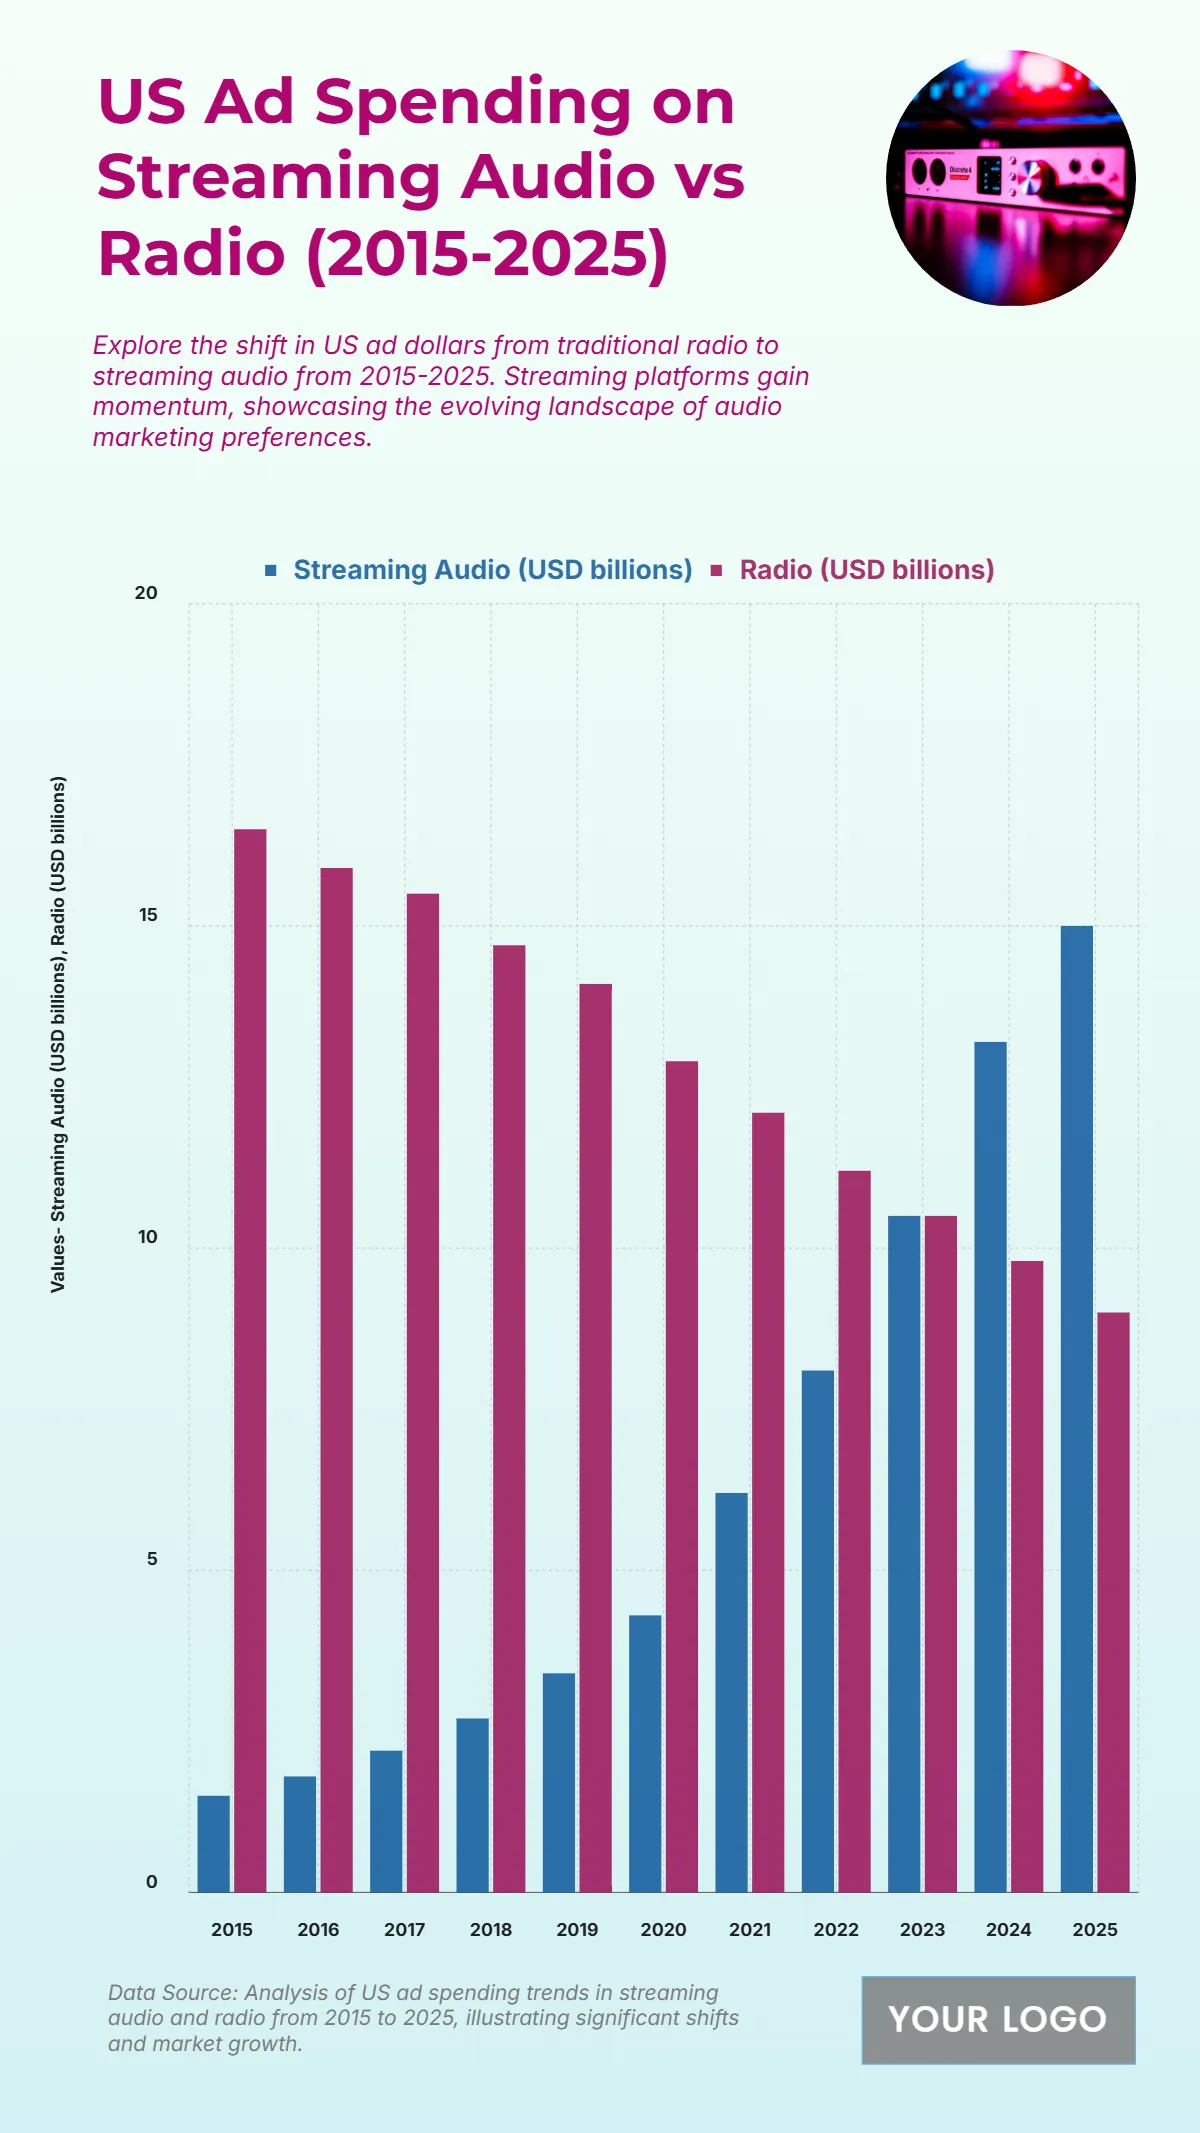
The chart displays the US Ad Spending on Streaming Audio (USD billions) versus Radio (USD billions) from 2015 to 2025, illustrating a definitive shift from traditional radio to streaming audio. Radio Ad Spending shows a consistent and significant decline, falling from 16.5 billion USD in 2015 to 9 billion USD in 2025. Conversely, Streaming Audio Ad Spending shows a strong, continuous increase, rising from 1.5 billion USD in 2015 to 15 billion USD in 2025. The two ad spending curves cross between 2022 and 2023, with both channels reaching 10.5 billion USD in 2023. By 2025, Streaming Audio spend is projected to be 6 billion USD higher than Radio spend ($\mathbf{15 \text{ billion USD} - 9 \text{ billion USD} = 6 \text{ billion USD}}$), confirming the profound transformation in US audio advertising preferences.
| Labels | Streaming Audio (USD billions) | Radio (USD billions) |
| 2015 | 1.5 | 16.5 |
| 2016 | 1.8 | 15.9 |
| 2017 | 2.2 | 15.5 |
| 2018 | 2.7 | 14.7 |
| 2019 | 3.4 | 14.1 |
| 2020 | 4.3 | 12.9 |
| 2021 | 6.2 | 12.1 |
| 2022 | 8.1 | 11.2 |
| 2023 | 10.5 | 10.5 |
| 2024 | 13.2 | 9.8 |
| 2025 | 15 | 9 |


