Free US Video Ad Spend Distribution by Format from 2015 to 2025 Chart
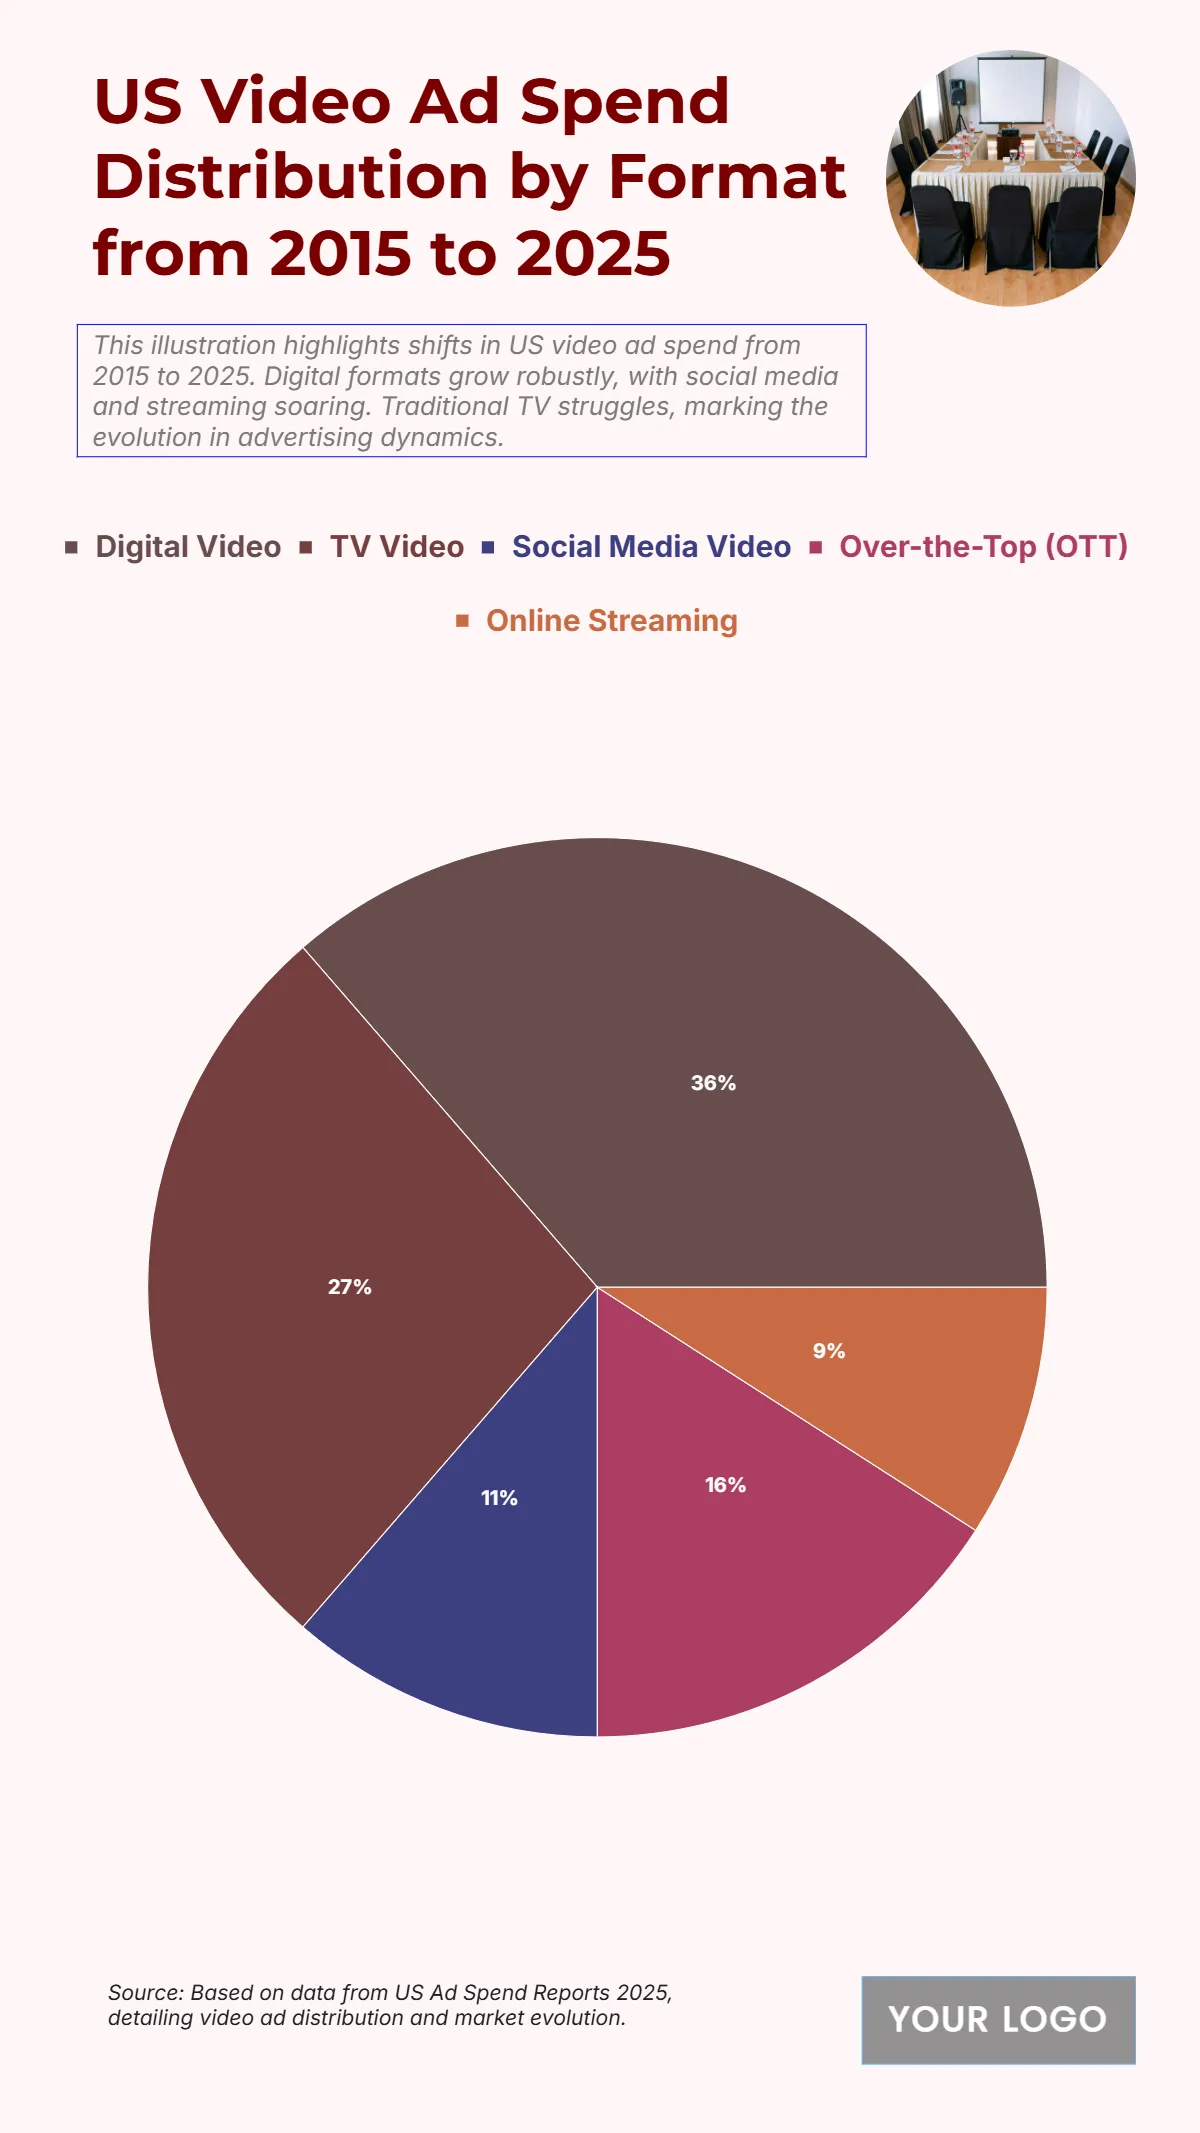
The chart emphasizes how digital video formats dominate ad spending, reflecting evolving viewing behaviors and the rapid shift from traditional television to online platforms. Digital video leads with USD 80 billion, showcasing the growing significance of on-demand, programmatic, and streaming video content in attracting advertiser budgets. TV video still holds a considerable USD 60 billion, proving the continued relevance of linear television, albeit at a slower growth pace. Over-the-top (OTT) platforms, including streaming services like Hulu, Roku, and connected TV channels, capture USD 35 billion, highlighting consumer migration to flexible, internet-delivered content. Social media video, at USD 25 billion, represents a fast-growing sector powered by short-form content on platforms like TikTok and Instagram Reels. Online streaming, at USD 20 billion, complements these segments through more specialized ad placements. This distribution clearly demonstrates a strategic reallocation of budgets from traditional to digital-first formats, reflecting advertisers’ pursuit of better targeting, interactivity, and cross-device reach.
| Format | Total Spend 2015–2025 (USD billions) |
|---|---|
| Digital Video | 80 |
| TV Video | 60 |
| Social Media Video | 25 |
| Over-the-Top (OTT) | 35 |
| Online Streaming | 20 |


