Free US E-commerce Ad Revenue vs Traffic Growth from 2015 to 2025 Chart
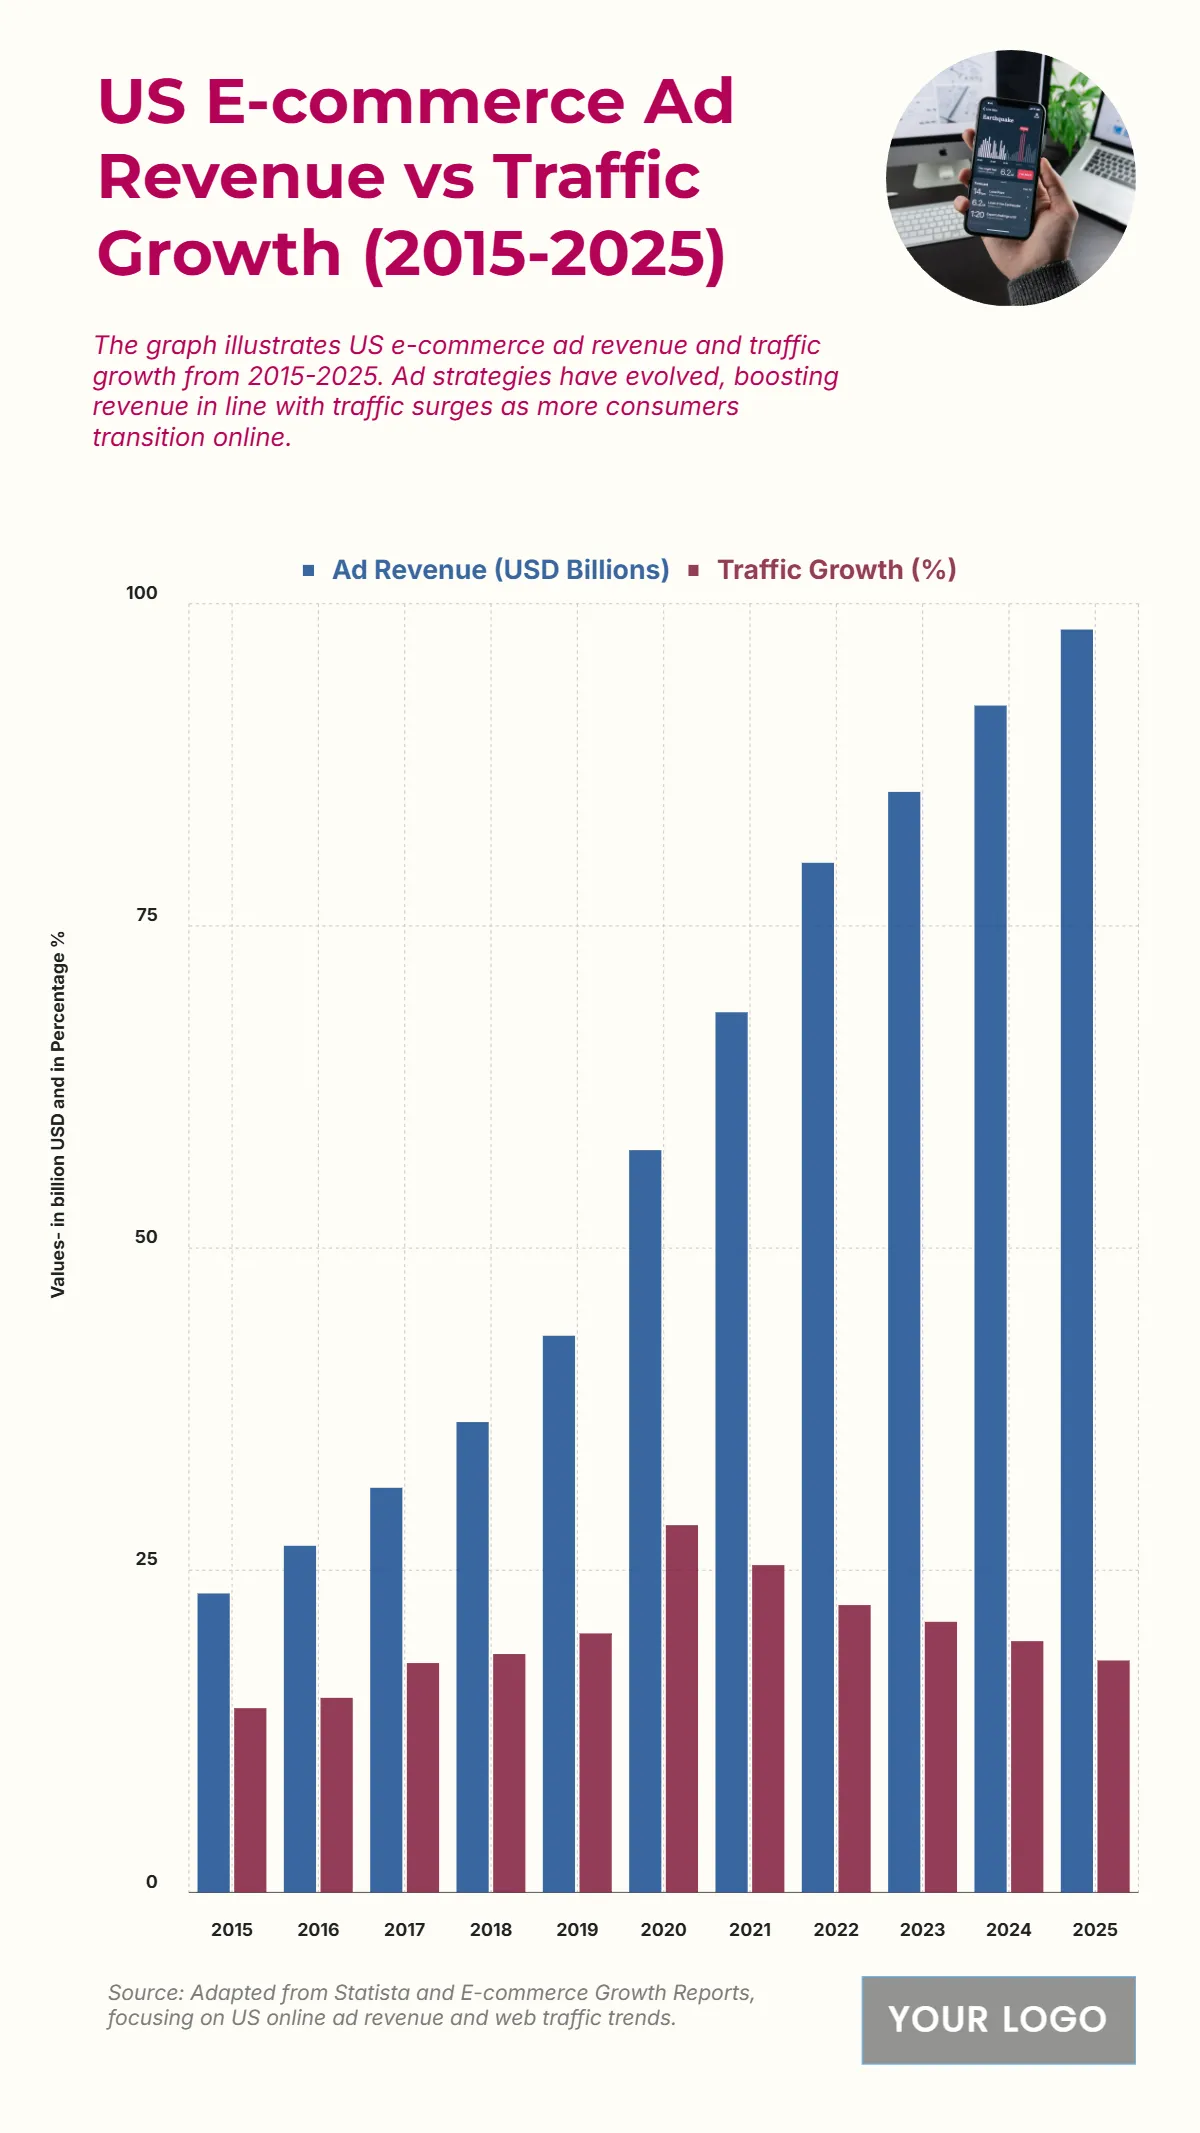
The chart displays the US E-commerce Ad Revenue (USD Billions) and Traffic Growth (%) from 2015 to 2025, illustrating a strong positive correlation between the two metrics. Ad Revenue (USD Billions) showed a dramatic and continuous increase, starting at 23.2 billion USD in 2015 and projected to nearly quadruple to 98 billion USD in 2025. Traffic Growth (%) shows a more varied pattern, peaking at 28.5% in 2020, then gradually declining to a projected 18% in 2025, having started at 14.3% in 2015. Despite the slower traffic growth in later years, ad revenue continued its steep climb, indicating more effective monetization of existing traffic. By 2025, Ad Revenue is projected to reach its highest point, reinforcing the commercial success of e-commerce advertising strategies.
| Labels | Ad Revenue (USD Billions) | Traffic Growth (%) |
| 2015 | 23.2 | 14.3 |
| 2016 | 26.9 | 15.1 |
| 2017 | 31.4 | 17.8 |
| 2018 | 36.5 | 18.5 |
| 2019 | 43.2 | 20.1 |
| 2020 | 57.6 | 28.5 |
| 2021 | 68.3 | 25.4 |
| 2022 | 79.9 | 22.3 |
| 2023 | 85.4 | 21 |
| 2024 | 92.1 | 19.5 |
| 2025 | 98 | 18 |


