Free US Mobile Ad Revenue by Industry from 2015 to 2025 Chart
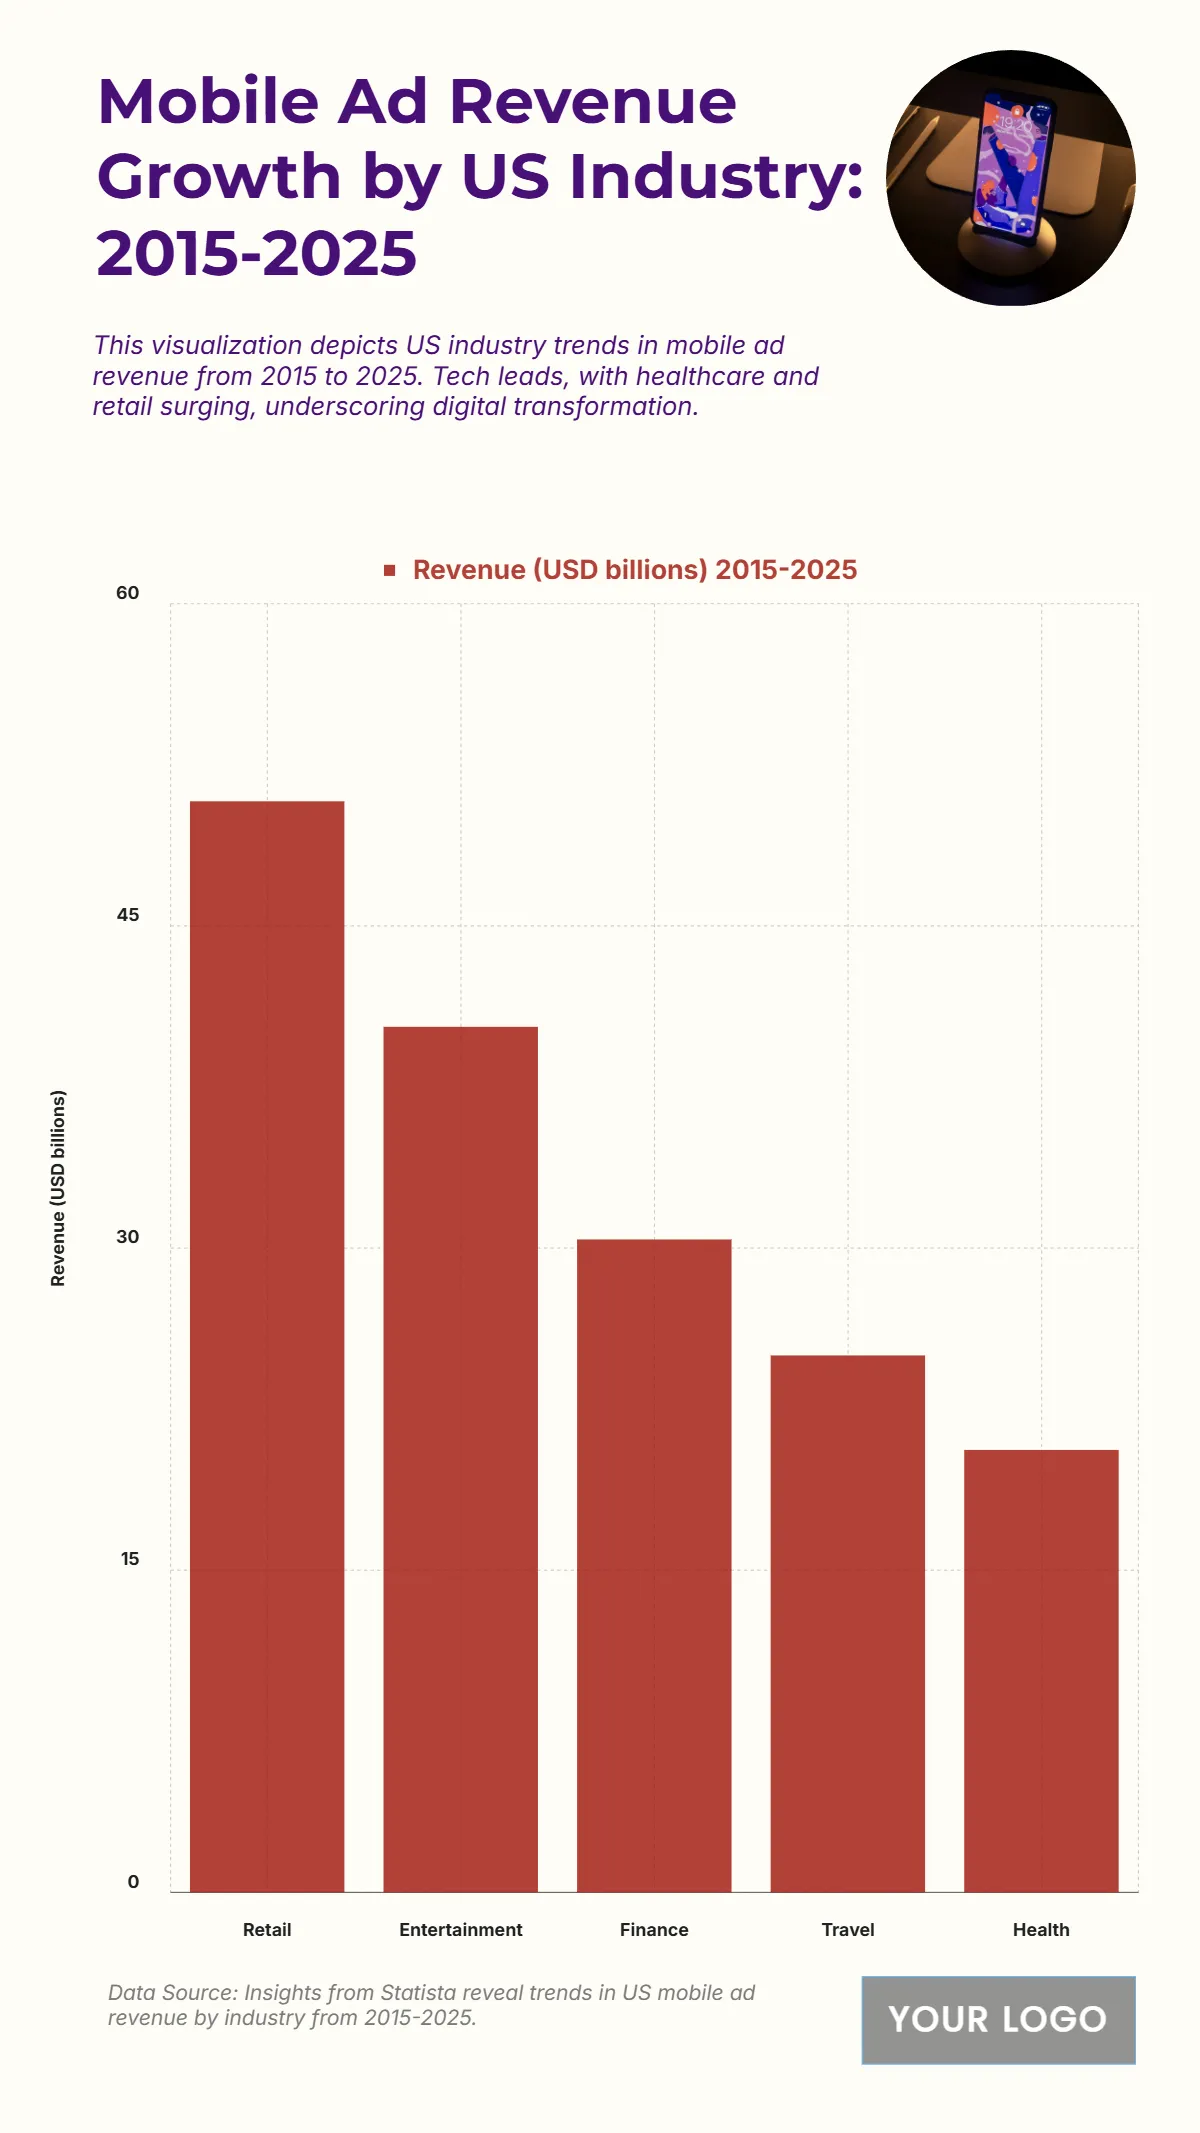
The chart displays the Mobile Ad Revenue (USD billions) from 2015 to 2025 by US industry, illustrating the total revenue generated by five key sectors. Retail is the dominant sector, generating the highest total revenue at 50.8 billion USD. Entertainment follows as the second-largest sector, with 40.3 billion USD in revenue. Finance is the third-highest sector with 30.4 billion USD. Travel and Health generate the lowest revenues, with Travel at 25 billion USD and Health at 20.6 billion USD. The combined revenue of Retail and Entertainment is 91.1 billion USD ($\mathbf{50.8 \text{ billion USD} + 40.3 \text{ billion USD} = 91.1 \text{ billion USD}}$), which is significantly higher than the other three sectors combined, highlighting their central role in driving US mobile ad revenue.
| Labels | Revenue (USD billions) 2015–2025 |
| Retail | 50.8 |
| Entertainment | 40.3 |
| Finance | 30.4 |
| Travel | 25 |
| Health | 20.6 |


