Free US Advertising Reach by Device Type from 2020 to 2025 Chart
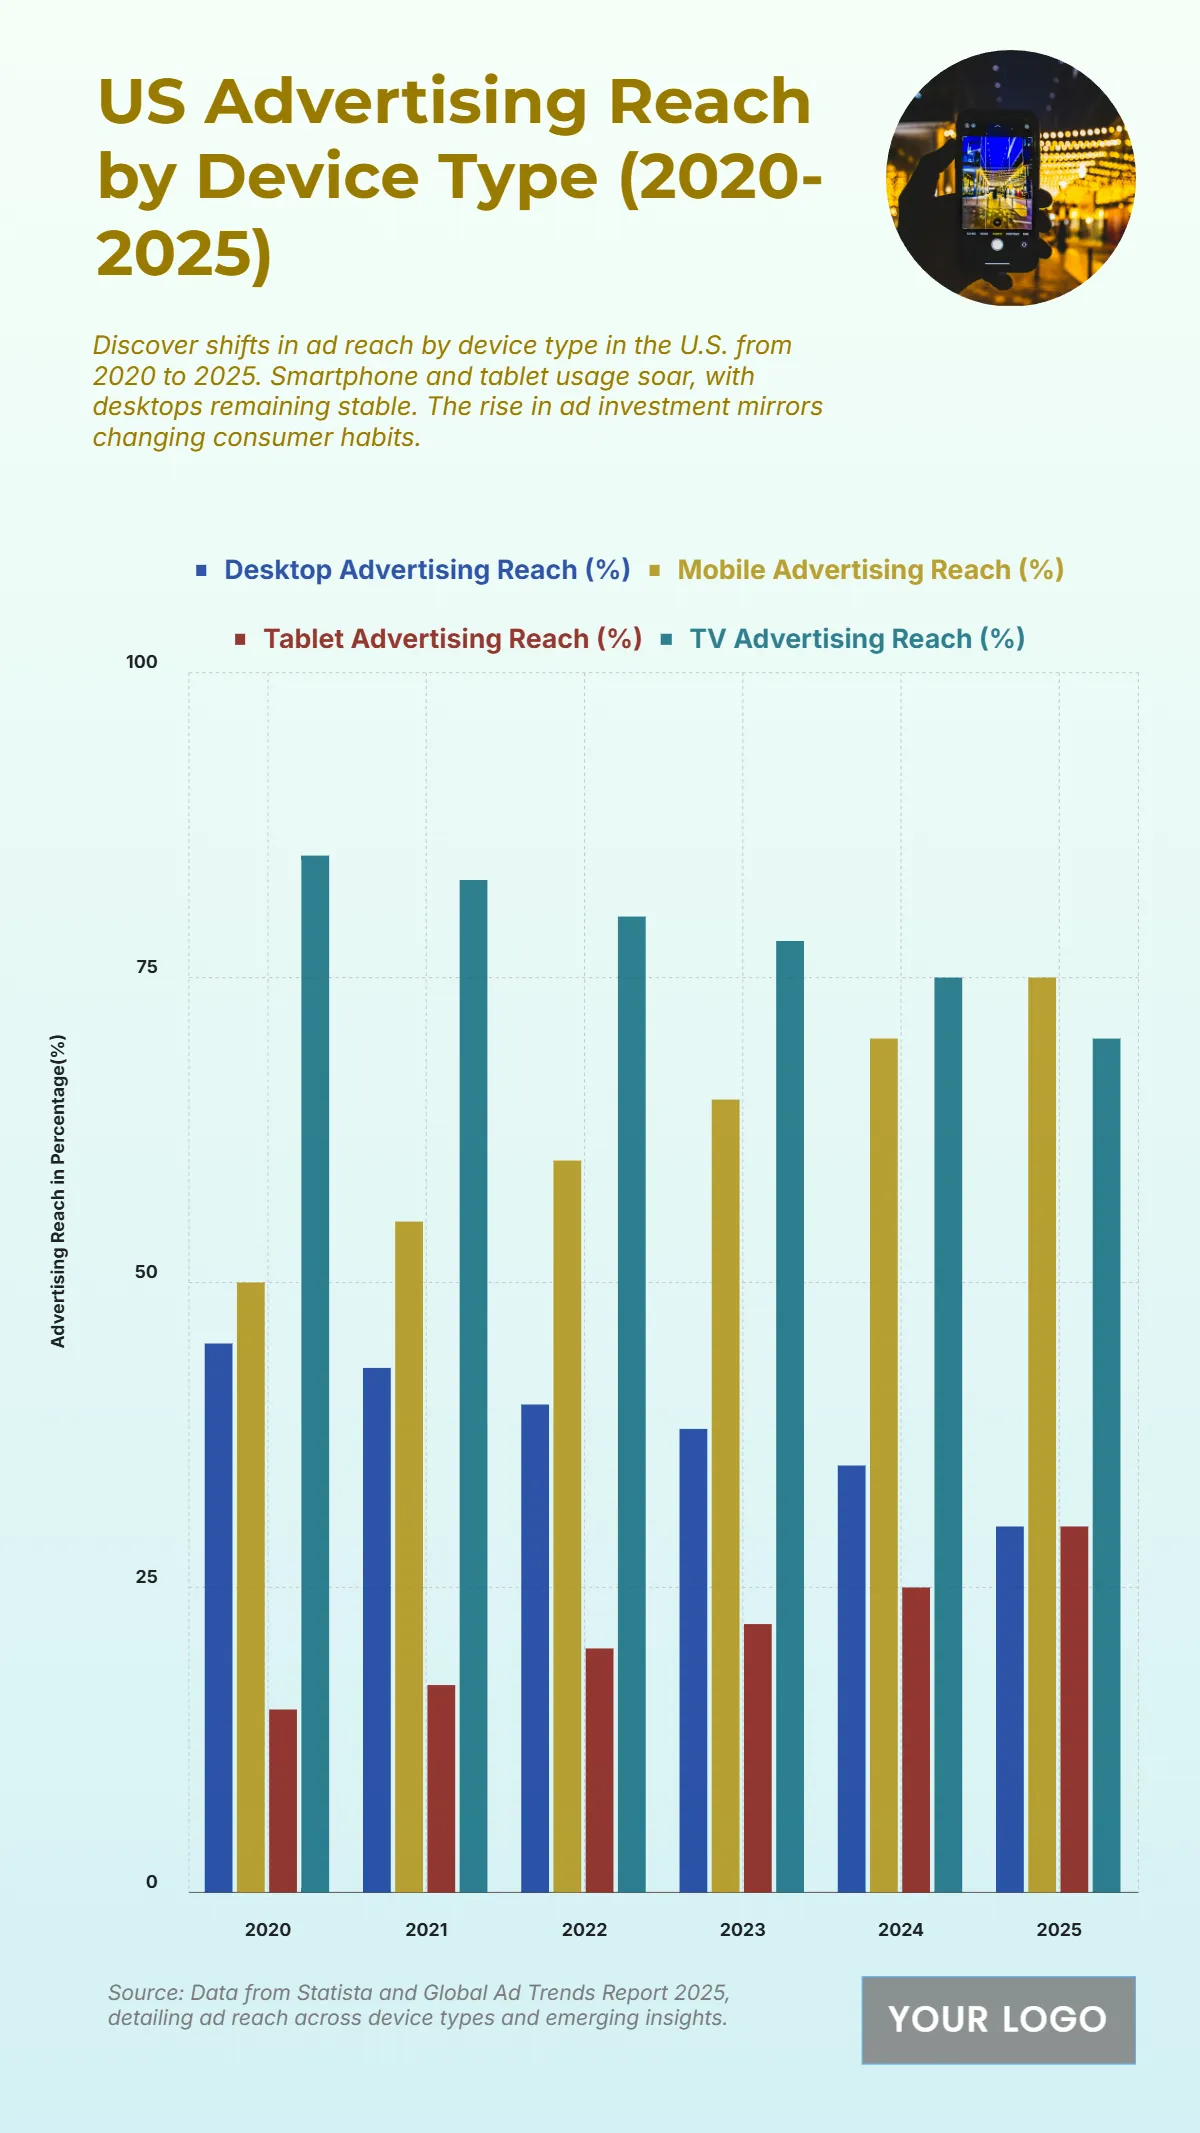
The chart displays the US Advertising Reach by Device Type from 2020 to 2025 in percentages, illustrating a significant shift toward mobile devices at the expense of desktop. Mobile Advertising Reach (%) is the highest and fastest-growing metric, starting at 50% in 2020 and projected to reach 75% in 2025. Conversely, Desktop Advertising Reach (%) shows a consistent and notable decline, falling from 45% in 2020 to 30% in 2025. Tablet Advertising Reach (%) shows an increasing trend, growing from 15% in 2020 to 30% in 2025. The data for TV Advertising Reach (%) shows a slight variation, starting at 80% in 2020 and projected to be 70% in 2025. The trend highlights the overwhelming importance of Mobile advertising, which is projected to have a 45 percentage point higher reach than Desktop advertising by 2025 ($\mathbf{75\% - 30\% = 45\%}$).
| Labels | Desktop Advertising Reach (%) | Mobile Advertising Reach (%) | Tablet Advertising Reach (%) | TV Advertising Reach (%) |
| 2020 | 45 | 50 | 15 | 80 |
| 2021 | 43 | 55 | 17 | 85 |
| 2022 | 40 | 60 | 20 | 80 |
| 2023 | 38 | 65 | 22 | 75 |
| 2024 | 35 | 70 | 25 | 70 |
| 2025 | 30 | 75 | 30 | 70 |


