Free US Mobile Advertising Revenue Distribution from 2020 to 2025 Chart
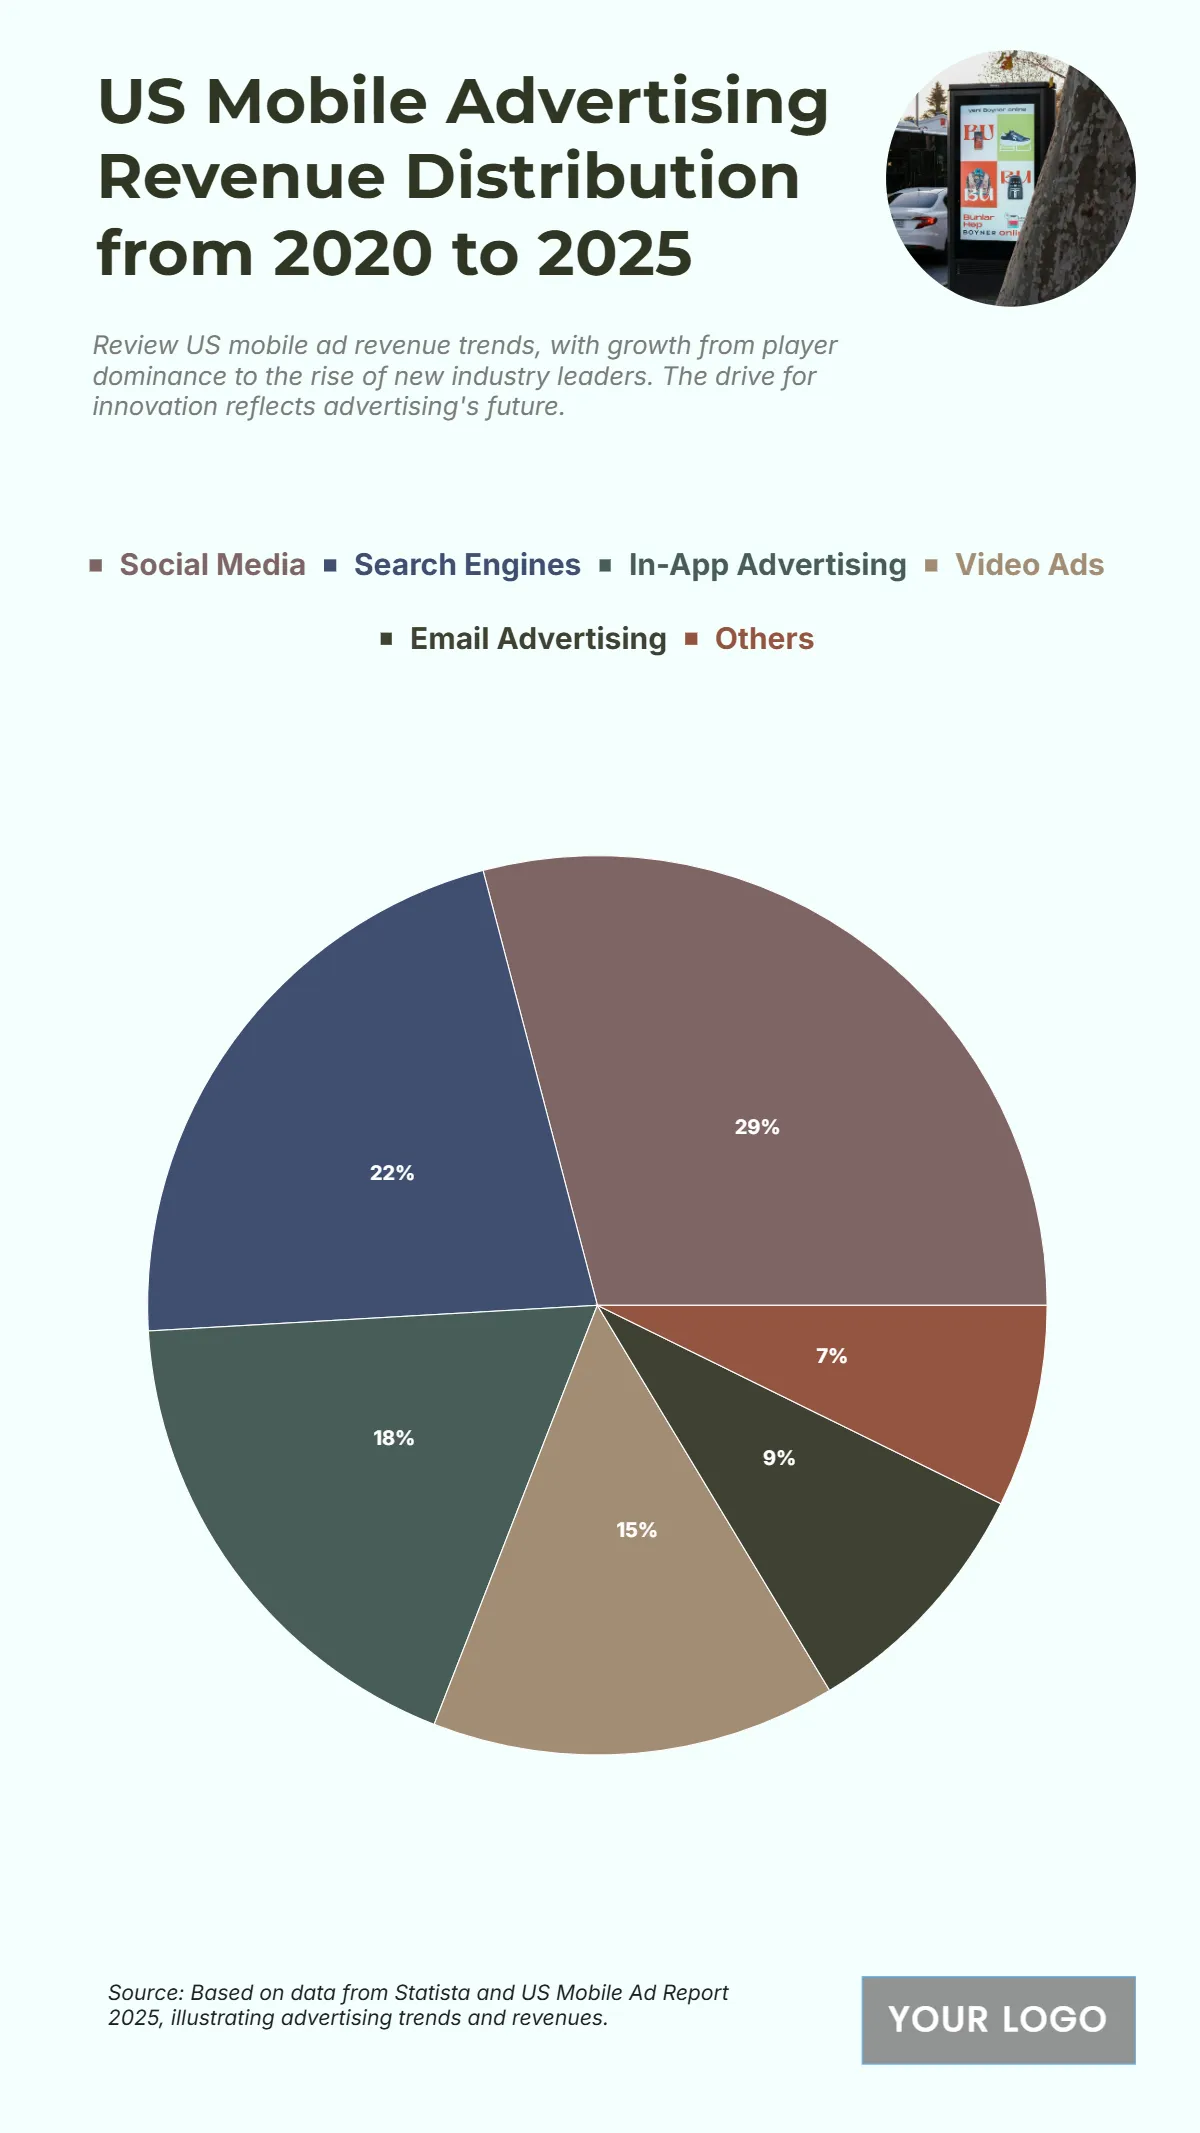
The chart reveals the dominance of social media advertising in the mobile ecosystem, with USD 80 billion in revenue, making it the largest segment from 2020 to 2025. Search engines follow with USD 60 billion, highlighting the enduring relevance of mobile search as a performance-driven channel. In-app advertising, at USD 50 billion, showcases the power of mobile apps in capturing user attention and driving conversions. Video ads, generating USD 40 billion, reflect the rise of mobile video consumption across platforms like YouTube, TikTok, and Instagram. Meanwhile, email advertising contributes USD 25 billion, and other channels add USD 20 billion, illustrating supporting roles in omni-channel strategies. This distribution shows a clear prioritization of immersive, user-engaged formats like social media and video, aligned with shifting consumer behavior toward mobile-first experiences. It highlights how mobile has become the central pillar of digital advertising, shaping budget allocation and strategy across industries.
| Channel | 2020–2025 Revenue (USD billions) |
|---|---|
| Social Media | 80 |
| Search Engines | 60 |
| In-App Advertising | 50 |
| Video Ads | 40 |
| Email Advertising | 25 |
| Others | 20 |


