Free US Advertising Spending by Channel from 2020 to 2025 Chart
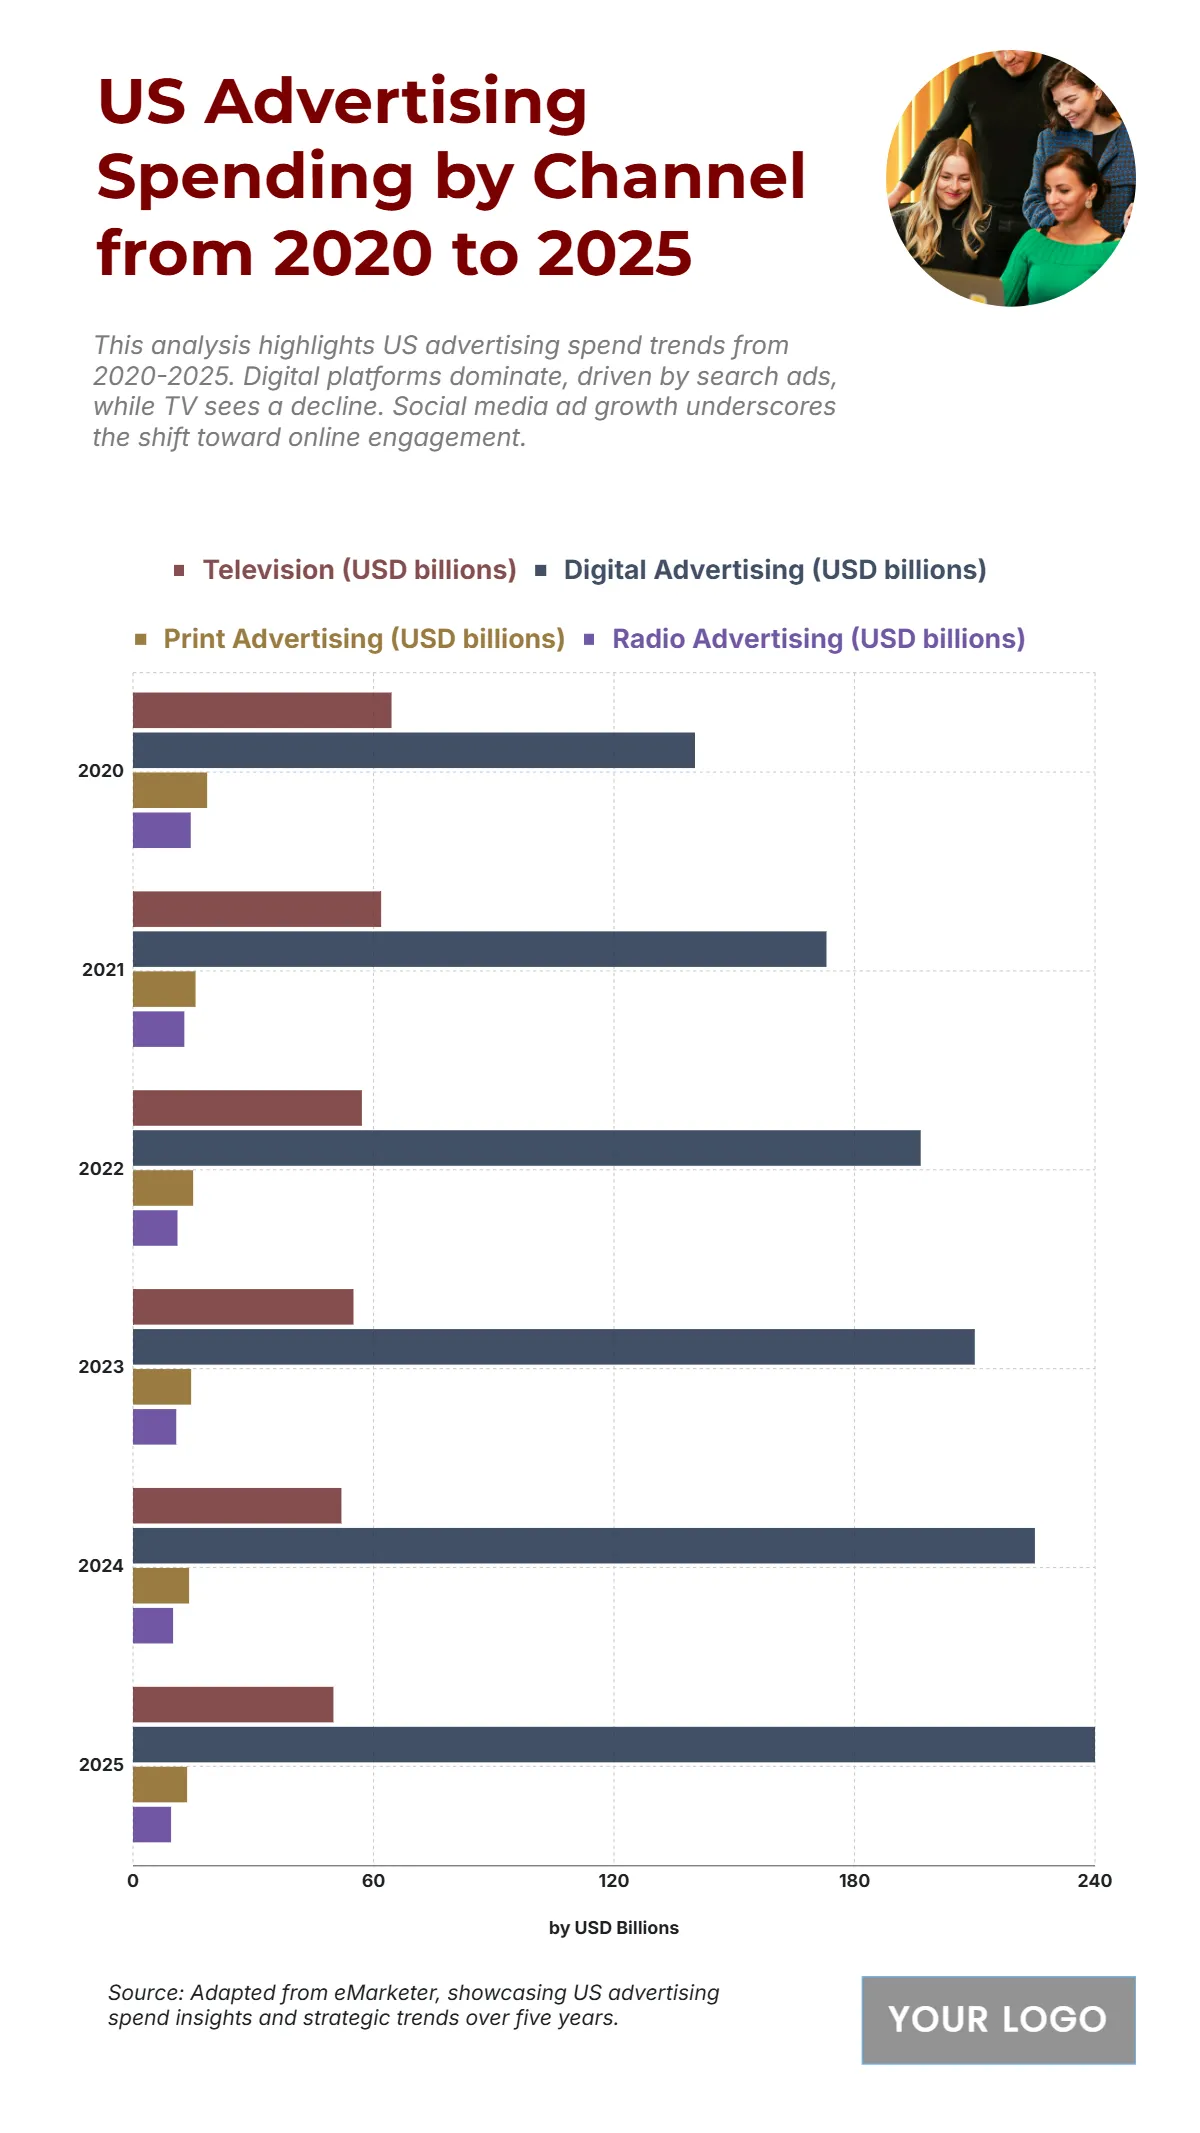
The chart displays the US Advertising Spending (USD billions) by Channel from 2020 to 2025, illustrating a dramatic and continuous shift toward Digital Advertising (USD billions) and a consistent decline in traditional media spending. Digital Advertising (USD billions) revenue saw exponential growth, rising from 140.2 billion USD in 2020 to 240 billion USD in 2025. In contrast, Television (USD billions) revenue consistently decreased from 64.5 billion USD in 2020 to 50 billion USD in 2025. Similarly, Radio Advertising (USD billions) declined from 14.4 billion USD to 9.5 billion USD, and Print Advertising (USD billions) fell from 18.5 billion USD to 13.5 billion USD in 2025. By 2025, Digital revenue is projected to be nearly five times that of Television revenue ($\mathbf{240 \text{ billion USD} / 50 \text{ billion USD} = 4.8}$), confirming the high-speed evolution of the US advertising market toward digital channels.
| Labels | Television (USD billions) | Digital Advertising (USD billions) | Print Advertising (USD billions) | Radio Advertising (USD billions) |
| 2020 | 64.5 | 140.2 | 18.5 | 14.4 |
| 2021 | 61.9 | 173 | 15.6 | 12.8 |
| 2022 | 57.1 | 196.5 | 15 | 11.1 |
| 2023 | 55 | 210 | 14.5 | 10.8 |
| 2024 | 52 | 225 | 14 | 10 |
| 2025 | 50 | 240 | 13.5 | 9.5 |


